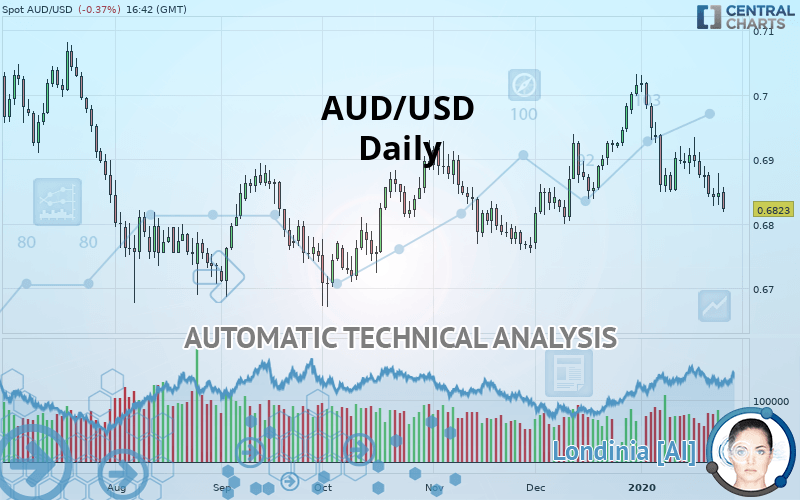
AUD/USD - Daily - Technical analysis published on 01/24/2020 (GMT)
- Who voted?
- 195
- 0
Click here for a new analysis!
- Timeframe : Daily
- - Analysis generated on
- Status : TARGET REACHED

Summary of the analysis

Additional analysis
Quotes
AUD/USD rating 0.6823 USD. On the day, this instrument lost -0.37% and was between 0.6819 USD and 0.6857 USD. This implies that the price is at +0.06% from its lowest and at -0.50% from its highest.The Central Gaps scanner detects a bullish opening. A small advantage for buyers in the very short term.
Bullish opening
Type : Bullish
Timeframe : Openning
So that you have an overall view of the price change, here is a table showing the variations over several periods:
Near a new LOW record (5 years)
Type : Bearish
Timeframe : Weekly
Near a new HIGH record (1st january)
Type : Bullish
Timeframe : Weekly
Near a new HIGH record (1 month)
Type : Bullish
Timeframe : Weekly
Technical
Technical analysis of AUD/USD in Daily shows an overall bearish trend. 64.29% of the signals given by moving averages are bearish. The overall trend is reinforced by the strong bearish signals from short-term moving averages. An assessment of moving averages reveals a bullish signal that could impact this trend:
Bullish price crossover with Moving Average 100
Type : Bullish
Timeframe : Daily
In fact, 12 technical indicators on 18 studied are currently bearish. But beware of excesses. The Central Indicators scanner currently detects this:
MACD indicator: bullish divergence
Type : Bullish
Timeframe : Daily
RSI indicator: bullish divergence
Type : Bullish
Timeframe : Daily
Williams %R indicator is oversold : under -80
Type : Neutral
Timeframe : Daily
Pivot points : price is under support 1
Type : Neutral
Timeframe : Daily
Pivot points : price is under support 3
Type : Neutral
Timeframe : Weekly
The Central Patterns scanner, which studies chart patterns, resistances and supports, has identified these signals:
Near horizontal support
Type : Bullish
Timeframe : Daily
Near support of triangle
Type : Bullish
Timeframe : Daily
Support of channel is broken
Type : Bearish
Timeframe : Daily
The Central Candlesticks scanner which studies Japanese candlesticks did not detect anything.
| S3 | S2 | S1 | Price | R1 | R2 | R3 | |
|---|---|---|---|---|---|---|---|
| ProTrendLines | 0.6708 | 0.6762 | 0.6811 | 0.6823 | 0.6874 | 0.6925 | 0.7018 |
| Change (%) | -1.69% | -0.89% | -0.18% | - | +0.75% | +1.49% | +2.86% |
| Change | -0.0115 | -0.0061 | -0.0012 | - | +0.0051 | +0.0102 | +0.0195 |
| Level | Major | Intermediate | Minor | - | Major | Minor | Minor |
Pivot points can also be used to set your price objectives. Here is the price situation in relation to pivot points:
| Pivot points | S3 | S2 | S1 | PP | R1 | R2 | R3 |
|---|---|---|---|---|---|---|---|
| Standard | 0.6775 | 0.6802 | 0.6825 | 0.6852 | 0.6875 | 0.6902 | 0.6925 |
| Camarilla | 0.6834 | 0.6839 | 0.6843 | 0.6848 | 0.6853 | 0.6857 | 0.6862 |
| Woodie | 0.6773 | 0.6801 | 0.6823 | 0.6851 | 0.6873 | 0.6901 | 0.6923 |
| Fibonacci | 0.6802 | 0.6821 | 0.6833 | 0.6852 | 0.6871 | 0.6883 | 0.6902 |
| Pivot points | S3 | S2 | S1 | PP | R1 | R2 | R3 |
|---|---|---|---|---|---|---|---|
| Standard | 0.6790 | 0.6831 | 0.6853 | 0.6894 | 0.6916 | 0.6957 | 0.6979 |
| Camarilla | 0.6859 | 0.6864 | 0.6870 | 0.6876 | 0.6882 | 0.6888 | 0.6893 |
| Woodie | 0.6782 | 0.6826 | 0.6845 | 0.6889 | 0.6908 | 0.6952 | 0.6971 |
| Fibonacci | 0.6831 | 0.6855 | 0.6870 | 0.6894 | 0.6918 | 0.6933 | 0.6957 |
| Pivot points | S3 | S2 | S1 | PP | R1 | R2 | R3 |
|---|---|---|---|---|---|---|---|
| Standard | 0.6570 | 0.6665 | 0.6841 | 0.6936 | 0.7112 | 0.7207 | 0.7383 |
| Camarilla | 0.6942 | 0.6966 | 0.6991 | 0.7016 | 0.7041 | 0.7066 | 0.7091 |
| Woodie | 0.6610 | 0.6685 | 0.6881 | 0.6956 | 0.7152 | 0.7227 | 0.7423 |
| Fibonacci | 0.6665 | 0.6769 | 0.6833 | 0.6936 | 0.7040 | 0.7104 | 0.7207 |
Numerical data
The following are the details of the technical indicators and moving averages that were collected to generate this technical analysis:
| RSI (14): | 37.60 | |
| MACD (12,26,9): | -0.0014 | |
| Directional Movement: | -5.2975 | |
| AROON (14): | -100.0000 | |
| DEMA (21): | 0.6869 | |
| Parabolic SAR (0,02-0,02-0,2): | 0.6898 | |
| Elder Ray (13): | -0.0033 | |
| Super Trend (3,10): | 0.6956 | |
| Zig ZAG (10): | 0.6823 | |
| VORTEX (21): | 0.8806 | |
| Stochastique (14,3,5): | 9.93 | |
| TEMA (21): | 0.6844 | |
| Williams %R (14): | -95.00 | |
| Chande Momentum Oscillator (20): | -0.0051 | |
| Repulse (5,40,3): | -0.8151 | |
| ROCnROLL: | 2 | |
| TRIX (15,9): | -0.0030 | |
| Courbe Coppock: | 2.56 |
| MA7: | 0.6858 | |
| MA20: | 0.6905 | |
| MA50: | 0.6871 | |
| MA100: | 0.6844 | |
| MAexp7: | 0.6854 | |
| MAexp20: | 0.6881 | |
| MAexp50: | 0.6877 | |
| MAexp100: | 0.6870 | |
| Price / MA7: | -0.51% | |
| Price / MA20: | -1.19% | |
| Price / MA50: | -0.70% | |
| Price / MA100: | -0.31% | |
| Price / MAexp7: | -0.45% | |
| Price / MAexp20: | -0.84% | |
| Price / MAexp50: | -0.79% | |
| Price / MAexp100: | -0.68% |
News
Don"t forget to follow the news on AUD/USD. At the time of publication of this analysis, the latest news was as follows:
-
 USD/JPY and AUD/USD Forecast January 24, 2020
-
AUD/USD Technical Analysis for January 24, 2020 by FXEmpire
-
USD/JPY and AUD/USD Forecast January 23, 2020
-
AUD/USD Technical Analysis for January 23, 2020 by FXEmpire
-
USD/CAD, AUD/USD, EUR/USD, NZD/CAD Analysis (Traders Buy-Sell Bets)
About author

Online


Add a comment
Comments
0 comments on the analysis AUD/USD - Daily