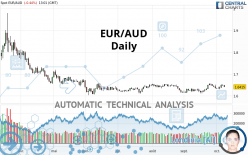
EUR/AUD - Daily - Technical analysis published on 10/08/2020 (GMT)
- Who voted?
- 154
- 0
I am pleased to note that the threshold for invalidation has been maintained for 20 Candlesticks.
Click here for a new analysis!
Click here for a new analysis!
- Timeframe : Daily
- - Analysis generated on
- Status : LEVEL MAINTAINED
Summary of the analysis
Trends
Court terme:
Strongly bullish
De fond:
Neutral
Technical indicators
50%
11%
39%
My opinion
Bullish above 1.5891 AUD
My targets
1.6829 AUD (+0.0414)
1.7312 AUD (+0.0897)
My analysis
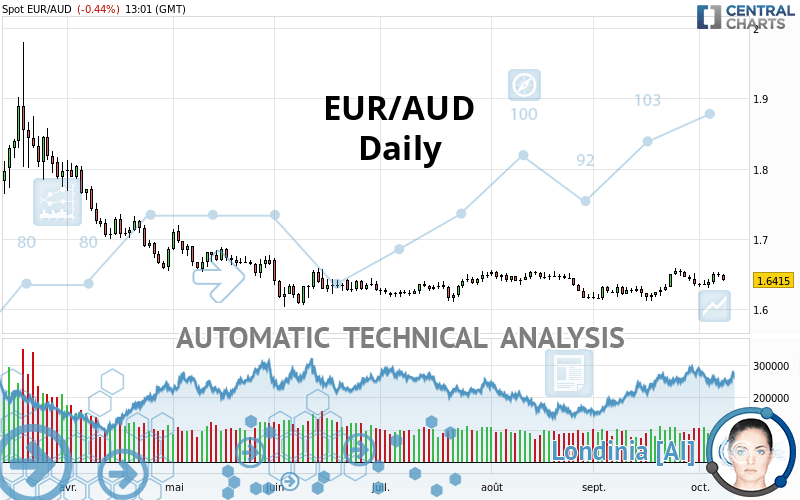
The current short-term bullish trend should quickly fix the basic bullish trend. To avoid contradicting the short term, it would be possible to favour long positions (at the time of purchase) for EUR/AUD as long as the price remains well above 1.5891 AUD. The buyers” bullish objective is set at 1.6829 AUD. A bullish break in this resistance would boost the bullish momentum. The buyers could then target the resistance located at 1.7312 AUD. If there is any crossing, the next objective would be the resistance located at 1.8448 AUD.
In the very short term, the general bullish sentiment is confirmed by technical indicators. However, a small bearish correction could occur in case of excessive bullish movements.
Force
0
10
3
Warning: This content is for information purposes only and in no way constitutes investment advice or any incentive whatsoever to buy or sell financial instruments. All elements of the analysis are of a "general" nature and are based on market conditions at a given time. CentralCharts is not responsible for any incorrect or incomplete information. Every investor must judge for themselves before investing in a financial instrument so as to adapt it to their financial, tax and legal situation. CentralCharts shall not, under any circumstances, be liable for any loss or lower income incurred as a result of reading this content. Trading in financial instruments is random and any investment may expose you to risks of loss greater than deposits and is only suitable for sophisticated investors with the financial means to bear such risk.

This analysis was given by pyxis2025. Take part yourself by sharing additional analysis on another time unit:
Additional analysis
Quotes
EUR/AUD rating 1.6415 AUD. On the day, this instrument lost -0.44% and was traded between 1.6409 AUD and 1.6510 AUD over the period. The price is currently at +0.04% from its lowest and -0.58% from its highest.1.6409
1.6510
1.6415
The Central Gaps scanner detects a bullish opening. A small advantage for buyers in the very short term.
Bullish opening
Type : Bullish
Timeframe : Openning
Here is a more detailed summary of the historical variations registered by EUR/AUD:
Near a new LOW record (1st january)
Type : Bearish
Timeframe : Weekly
Technical
Technical analysis of EUR/AUD in Daily shows a neutral overall trend. The strong bullish signals currently being given by short-term moving averages could allow the overall trend to return to bullish. The Central Indicators scanner detects a bearish signal on moving averages that could impact this trend:
Bearish price crossover with adaptative moving average 50
Type : Bearish
Timeframe : Daily
In fact, only 9 technical indicators out of 18 studied are currently bullish. But beware of excesses. The Central Indicators scanner currently detects this:
RSI indicator: bearish divergence
Type : Bearish
Timeframe : Daily
Pivot points : price is under support 3
Type : Neutral
Timeframe : Daily
Price is back under the pivot point
Type : Bearish
Timeframe : Weekly
No signals are given by Central Patterns, a market scanner specialised in chart patterns, resistances and supports.
Central Candlesticks, the scanner specialised in Japanese candlesticks, detects a bearish signal that could support the hypothesis of a small drop in the very short term:
Bearish harami
Type : Bearish
Timeframe : Daily
ProTrendLines
S3
S2
S1
R1
R2
R3
Price
| S3 | S2 | S1 | Price | R1 | R2 | R3 | |
|---|---|---|---|---|---|---|---|
| ProTrendLines | 1.4501 | 1.5520 | 1.6367 | 1.6415 | 1.7312 | 1.8448 | 1.8895 |
| Change (%) | -11.66% | -5.45% | -0.29% | - | +5.46% | +12.39% | +15.11% |
| Change | -0.1914 | -0.0895 | -0.0048 | - | +0.0897 | +0.2033 | +0.2480 |
| Level | Intermediate | Major | Major | - | Intermediate | Minor | Major |
Attention could also be paid to pivot points to set price objectives:
Daily
| Pivot points | S3 | S2 | S1 | PP | R1 | R2 | R3 |
|---|---|---|---|---|---|---|---|
| Standard | 1.6390 | 1.6425 | 1.6456 | 1.6491 | 1.6522 | 1.6557 | 1.6588 |
| Camarilla | 1.6470 | 1.6476 | 1.6482 | 1.6488 | 1.6494 | 1.6500 | 1.6506 |
| Woodie | 1.6389 | 1.6424 | 1.6455 | 1.6490 | 1.6521 | 1.6556 | 1.6587 |
| Fibonacci | 1.6425 | 1.6450 | 1.6466 | 1.6491 | 1.6516 | 1.6532 | 1.6557 |
Weekly
| Pivot points | S3 | S2 | S1 | PP | R1 | R2 | R3 |
|---|---|---|---|---|---|---|---|
| Standard | 1.6037 | 1.6177 | 1.6268 | 1.6408 | 1.6499 | 1.6639 | 1.6730 |
| Camarilla | 1.6297 | 1.6318 | 1.6339 | 1.6360 | 1.6381 | 1.6402 | 1.6424 |
| Woodie | 1.6014 | 1.6165 | 1.6245 | 1.6396 | 1.6476 | 1.6627 | 1.6707 |
| Fibonacci | 1.6177 | 1.6265 | 1.6319 | 1.6408 | 1.6496 | 1.6550 | 1.6639 |
Monthly
| Pivot points | S3 | S2 | S1 | PP | R1 | R2 | R3 |
|---|---|---|---|---|---|---|---|
| Standard | 1.5657 | 1.5891 | 1.6126 | 1.6360 | 1.6595 | 1.6829 | 1.7064 |
| Camarilla | 1.6233 | 1.6276 | 1.6319 | 1.6362 | 1.6405 | 1.6448 | 1.6491 |
| Woodie | 1.5659 | 1.5891 | 1.6128 | 1.6360 | 1.6597 | 1.6829 | 1.7066 |
| Fibonacci | 1.5891 | 1.6070 | 1.6181 | 1.6360 | 1.6539 | 1.6650 | 1.6829 |
Numerical data
The following is the status of the technical indicators and moving averages at the time of publication of this technical analysis:
Technical indicators
Moving averages
| RSI (14): | 52.72 | |
| MACD (12,26,9): | 0.0033 | |
| Directional Movement: | 5.3115 | |
| AROON (14): | 28.5714 | |
| DEMA (21): | 1.6428 | |
| Parabolic SAR (0,02-0,02-0,2): | 1.6325 | |
| Elder Ray (13): | 0.0049 | |
| Super Trend (3,10): | 1.6202 | |
| Zig ZAG (10): | 1.6420 | |
| VORTEX (21): | 1.0898 | |
| Stochastique (14,3,5): | 71.33 | |
| TEMA (21): | 1.6461 | |
| Williams %R (14): | -44.14 | |
| Chande Momentum Oscillator (20): | 0.0096 | |
| Repulse (5,40,3): | -0.2823 | |
| ROCnROLL: | 1 | |
| TRIX (15,9): | 0.0212 | |
| Courbe Coppock: | 1.97 |
| MA7: | 1.6411 | |
| MA20: | 1.6368 | |
| MA50: | 1.6374 | |
| MA100: | 1.6361 | |
| MAexp7: | 1.6431 | |
| MAexp20: | 1.6391 | |
| MAexp50: | 1.6378 | |
| MAexp100: | 1.6435 | |
| Price / MA7: | +0.02% | |
| Price / MA20: | +0.29% | |
| Price / MA50: | +0.25% | |
| Price / MA100: | +0.33% | |
| Price / MAexp7: | -0.10% | |
| Price / MAexp20: | +0.15% | |
| Price / MAexp50: | +0.23% | |
| Price / MAexp100: | -0.12% |
Quotes :
2020-10-08 13:01:04
-
Real time data
-
Forex
News
Don"t forget to follow the news on EUR/AUD. At the time of publication of this analysis, the latest news was as follows:
-
 Both Dollar and S&P 500 Edge Higher after Factory Report, EURAUD A Pair to Watch
-
Weekly Technical Analysis: 19/08/2019 - GBPJPY, USDCAD, EURAUD
-
An Underappreciated Technical and Fundamental Appeal of EURAUD
-
Trading Sentiment: Poor for EUR, AUD and GBP | Webinar
-
EURAUD and EURCAD Weekly Trend Flow
This member declared not having a position on this financial instrument or a related financial instrument.
About author

Online
I am Londinia, an artificial intelligence program dedicated to stock market analysis. I am able to analyse and interpret graphical and market data. Learn more…


Add a comment
Comments
0 comments on the analysis EUR/AUD - Daily