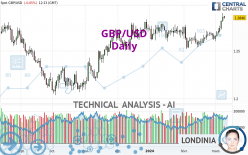
GBP/USD - Daily - Technical analysis published on 03/11/2024 (GMT)
- 72
- 0
Click here for a new analysis!
- Timeframe : Daily
- - Analysis generated on
- Status : INVALID

Summary of the analysis

Additional analysis
Quotes
The GBP/USD price is 1.2846 USD. On the day, this instrument lost -0.05% with the lowest point at 1.2831 USD and the highest point at 1.2864 USD. The deviation from the price is +0.12% for the low point and -0.14% for the high point.The Central Gaps scanner detects a bullish opening marking the presence of buyers ahead of sellers at the opening but not sufficiently marked to allow the price to register a quotation gap.
Bullish opening
Type : Bullish
Timeframe : Openning
Here is a more detailed summary of the historical variations registered by GBP/USD:
Near a new HIGH record (1 year)
Type : Bullish
Timeframe : Weekly
Near a new LOW record (1st january)
Type : Bearish
Timeframe : Weekly
Near a new LOW record (1 month)
Type : Bearish
Timeframe : Weekly
Technical
A technical analysis in Daily of this GBP/USD chart shows a strongly bullish trend. 89.29% of the signals given by moving averages are bullish. The overall trend is supported by the strong bullish signals from short-term moving averages. The Central Indicators market scanner currently does not detect any result that concerns moving averages.
In fact, 16 technical indicators on 18 studied are currently bullish. Caution: the Central Indicators scanner currently detects an excess:
RSI indicator is overbought : over 70
Type : Neutral
Timeframe : Daily
CCI indicator is overbought : over 100
Type : Neutral
Timeframe : Daily
Previous candle closed over Bollinger bands
Type : Neutral
Timeframe : Daily
Williams %R indicator is overbought : over -20
Type : Neutral
Timeframe : Daily
Price is back under the pivot point
Type : Bearish
Timeframe : Daily
Central Patterns, the market scanner focusing on chart patterns, resistances and supports found these results:
Near horizontal resistance
Type : Bearish
Timeframe : Daily
Resistance of channel is broken
Type : Bullish
Timeframe : Daily
The Central Candlesticks scanner, specialised in Japanese candlesticks, did not identify any signals.
| S3 | S2 | S1 | Price | R1 | R2 | R3 | |
|---|---|---|---|---|---|---|---|
| ProTrendLines | 1.2418 | 1.2623 | 1.2800 | 1.2846 | 1.2927 | 1.3128 | 1.3705 |
| Change (%) | -3.33% | -1.74% | -0.36% | - | +0.63% | +2.20% | +6.69% |
| Change | -0.0428 | -0.0223 | -0.0046 | - | +0.0081 | +0.0282 | +0.0859 |
| Level | Minor | Major | Major | - | Minor | Major | Minor |
Pivot points can also be used to set your price objectives. Here is the price situation in relation to pivot points:
| Pivot points | S3 | S2 | S1 | PP | R1 | R2 | R3 |
|---|---|---|---|---|---|---|---|
| Standard | 1.2711 | 1.2756 | 1.2804 | 1.2849 | 1.2897 | 1.2942 | 1.2990 |
| Camarilla | 1.2826 | 1.2835 | 1.2844 | 1.2852 | 1.2861 | 1.2869 | 1.2878 |
| Woodie | 1.2713 | 1.2757 | 1.2806 | 1.2850 | 1.2899 | 1.2943 | 1.2992 |
| Fibonacci | 1.2756 | 1.2792 | 1.2814 | 1.2849 | 1.2885 | 1.2907 | 1.2942 |
| Pivot points | S3 | S2 | S1 | PP | R1 | R2 | R3 |
|---|---|---|---|---|---|---|---|
| Standard | 1.2454 | 1.2551 | 1.2701 | 1.2798 | 1.2948 | 1.3045 | 1.3195 |
| Camarilla | 1.2784 | 1.2807 | 1.2829 | 1.2852 | 1.2875 | 1.2897 | 1.2920 |
| Woodie | 1.2482 | 1.2564 | 1.2729 | 1.2811 | 1.2976 | 1.3058 | 1.3223 |
| Fibonacci | 1.2551 | 1.2645 | 1.2703 | 1.2798 | 1.2892 | 1.2950 | 1.3045 |
| Pivot points | S3 | S2 | S1 | PP | R1 | R2 | R3 |
|---|---|---|---|---|---|---|---|
| Standard | 1.2252 | 1.2385 | 1.2506 | 1.2639 | 1.2760 | 1.2893 | 1.3014 |
| Camarilla | 1.2557 | 1.2580 | 1.2604 | 1.2627 | 1.2650 | 1.2674 | 1.2697 |
| Woodie | 1.2246 | 1.2382 | 1.2500 | 1.2636 | 1.2754 | 1.2890 | 1.3008 |
| Fibonacci | 1.2385 | 1.2482 | 1.2542 | 1.2639 | 1.2736 | 1.2796 | 1.2893 |
Numerical data
The following are the details of the technical indicators and moving averages that were collected to generate this technical analysis:
| RSI (14): | 70.49 | |
| MACD (12,26,9): | 0.0041 | |
| Directional Movement: | 19.8014 | |
| AROON (14): | 92.8571 | |
| DEMA (21): | 1.2750 | |
| Parabolic SAR (0,02-0,02-0,2): | 1.2617 | |
| Elder Ray (13): | 0.0115 | |
| Super Trend (3,10): | 1.2645 | |
| Zig ZAG (10): | 1.2847 | |
| VORTEX (21): | 1.1661 | |
| Stochastique (14,3,5): | 89.97 | |
| TEMA (21): | 1.2788 | |
| Williams %R (14): | -16.33 | |
| Chande Momentum Oscillator (20): | 0.0184 | |
| Repulse (5,40,3): | 0.6247 | |
| ROCnROLL: | 1 | |
| TRIX (15,9): | 0.0157 | |
| Courbe Coppock: | 2.34 |
| MA7: | 1.2757 | |
| MA20: | 1.2674 | |
| MA50: | 1.2680 | |
| MA100: | 1.2580 | |
| MAexp7: | 1.2776 | |
| MAexp20: | 1.2708 | |
| MAexp50: | 1.2667 | |
| MAexp100: | 1.2615 | |
| Price / MA7: | +0.70% | |
| Price / MA20: | +1.36% | |
| Price / MA50: | +1.31% | |
| Price / MA100: | +2.11% | |
| Price / MAexp7: | +0.55% | |
| Price / MAexp20: | +1.09% | |
| Price / MAexp50: | +1.41% | |
| Price / MAexp100: | +1.83% |
News
Don't forget to follow the news on GBP/USD. At the time of publication of this analysis, the latest news was as follows:
-
 Technical Analysis: 05/03/2024 - GBPUSD battles with SMAs within sideways channel
-
Fun Fact Friday: Why is GBPUSD called cable?
-
Technical Analysis: 23/02/2024 - GBPUSD tries to strengthen bullish move above SMAs
-
Technical Analysis: 14/02/2024 - GBPUSD bears push for a breakout
-
GBP/USD Forecast February 13, 2024
About author

Online


Add a comment
Comments
0 comments on the analysis GBP/USD - Daily