GBP/USD - Daily - Technical analysis published on 03/19/2024 (GMT)
- 97
- 0
Click here for a new analysis!
- Timeframe : Daily
- - Analysis generated on
- Status : INVALID

Summary of the analysis

Additional analysis
Quotes
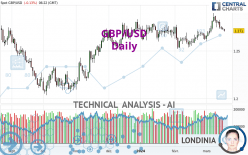
The GBP/USD price is 1.2710 USD. The price registered a decrease of -0.13% on the session and was traded between 1.2701 USD and 1.2729 USD over the period. The price is currently at +0.07% from its lowest and -0.15% from its highest.Here is a more detailed summary of the historical variations registered by GBP/USD:
Near a new HIGH record (1 year)
Type : Bullish
Timeframe : Weekly
Near a new HIGH record (1st january)
Type : Bullish
Timeframe : Weekly
Near a new HIGH record (1 month)
Type : Bullish
Timeframe : Weekly
Technical
Technical analysis of GBP/USD in Daily shows an overall bullish trend. 67.86% of the signals given by moving averages are bullish. Caution: the neutral signals currently given by short-term moving averages show us that the global trend is losing momentum. The Central Indicators market scanner is currently detecting several bearish signals that could impact this trend:
Bearish trend reversal : Moving Average 50
Type : Bearish
Timeframe : Daily
Bearish price crossover with Moving Average 20
Type : Bearish
Timeframe : Daily
Bearish price crossover with adaptative moving average 20
Type : Bearish
Timeframe : Daily
In fact, of the 18 technical indicators analysed by Central Analyzer, 5 are bullish, 8 are neutral and 5 are bearish. Central Indicators, the detector scanner for these technical indicators has recently detected several signals:
Pivot points : price is under support 1
Type : Neutral
Timeframe : Daily
RSI indicator is back under 50
Type : Bearish
Timeframe : Daily
MACD crosses DOWN its Moving Average
Type : Bearish
Timeframe : Daily
An analysis of the price chart with the Central Patterns scanner (detector of chart patterns and resistances and supports) shows a result that can have an impact on the price change:
Near support of triangle
Type : Bullish
Timeframe : Daily
The Central Candlesticks scanner which studies Japanese candlesticks did not detect anything.
| S3 | S2 | S1 | Price | R1 | R2 | R3 | |
|---|---|---|---|---|---|---|---|
| ProTrendLines | 1.2315 | 1.2418 | 1.2621 | 1.2710 | 1.2800 | 1.3128 | 1.3705 |
| Change (%) | -3.11% | -2.30% | -0.70% | - | +0.71% | +3.29% | +7.83% |
| Change | -0.0395 | -0.0292 | -0.0089 | - | +0.0090 | +0.0418 | +0.0995 |
| Level | Minor | Minor | Major | - | Major | Major | Minor |
Pivot points can also be used to set your price objectives. Here is the price situation in relation to pivot points:
| Pivot points | S3 | S2 | S1 | PP | R1 | R2 | R3 |
|---|---|---|---|---|---|---|---|
| Standard | 1.2685 | 1.2701 | 1.2714 | 1.2730 | 1.2743 | 1.2759 | 1.2772 |
| Camarilla | 1.2718 | 1.2721 | 1.2723 | 1.2726 | 1.2729 | 1.2731 | 1.2734 |
| Woodie | 1.2683 | 1.2700 | 1.2712 | 1.2729 | 1.2741 | 1.2758 | 1.2770 |
| Fibonacci | 1.2701 | 1.2712 | 1.2719 | 1.2730 | 1.2741 | 1.2748 | 1.2759 |
| Pivot points | S3 | S2 | S1 | PP | R1 | R2 | R3 |
|---|---|---|---|---|---|---|---|
| Standard | 1.2542 | 1.2633 | 1.2682 | 1.2773 | 1.2822 | 1.2913 | 1.2962 |
| Camarilla | 1.2693 | 1.2705 | 1.2718 | 1.2731 | 1.2744 | 1.2757 | 1.2770 |
| Woodie | 1.2521 | 1.2623 | 1.2661 | 1.2763 | 1.2801 | 1.2903 | 1.2941 |
| Fibonacci | 1.2633 | 1.2687 | 1.2720 | 1.2773 | 1.2827 | 1.2860 | 1.2913 |
| Pivot points | S3 | S2 | S1 | PP | R1 | R2 | R3 |
|---|---|---|---|---|---|---|---|
| Standard | 1.2252 | 1.2385 | 1.2506 | 1.2639 | 1.2760 | 1.2893 | 1.3014 |
| Camarilla | 1.2557 | 1.2580 | 1.2604 | 1.2627 | 1.2650 | 1.2674 | 1.2697 |
| Woodie | 1.2246 | 1.2382 | 1.2500 | 1.2636 | 1.2754 | 1.2890 | 1.3008 |
| Fibonacci | 1.2385 | 1.2482 | 1.2542 | 1.2639 | 1.2736 | 1.2796 | 1.2893 |
Numerical data
The following is the status of technical indicators and moving averages registered at the time this technical analysis was created:
| RSI (14): | 48.83 | |
| MACD (12,26,9): | 0.0025 | |
| Directional Movement: | 2.8311 | |
| AROON (14): | 35.7143 | |
| DEMA (21): | 1.2755 | |
| Parabolic SAR (0,02-0,02-0,2): | 1.2890 | |
| Elder Ray (13): | -0.0021 | |
| Super Trend (3,10): | 1.2633 | |
| Zig ZAG (10): | 1.2703 | |
| VORTEX (21): | 1.0903 | |
| Stochastique (14,3,5): | 40.93 | |
| TEMA (21): | 1.2768 | |
| Williams %R (14): | -63.95 | |
| Chande Momentum Oscillator (20): | 0.0051 | |
| Repulse (5,40,3): | -0.4855 | |
| ROCnROLL: | -1 | |
| TRIX (15,9): | 0.0328 | |
| Courbe Coppock: | 1.53 |
| MA7: | 1.2760 | |
| MA20: | 1.2720 | |
| MA50: | 1.2686 | |
| MA100: | 1.2615 | |
| MAexp7: | 1.2742 | |
| MAexp20: | 1.2723 | |
| MAexp50: | 1.2683 | |
| MAexp100: | 1.2630 | |
| Price / MA7: | -0.39% | |
| Price / MA20: | -0.08% | |
| Price / MA50: | +0.19% | |
| Price / MA100: | +0.75% | |
| Price / MAexp7: | -0.25% | |
| Price / MAexp20: | -0.10% | |
| Price / MAexp50: | +0.21% | |
| Price / MAexp100: | +0.63% |
News
The latest news and videos published on GBP/USD at the time of the analysis were as follows:
-
 Technical Analysis: 05/03/2024 - GBPUSD battles with SMAs within sideways channel
-
Fun Fact Friday: Why is GBPUSD called cable?
-
Technical Analysis: 23/02/2024 - GBPUSD tries to strengthen bullish move above SMAs
-
Technical Analysis: 14/02/2024 - GBPUSD bears push for a breakout
-
GBP/USD Forecast February 13, 2024
About author

Online


Add a comment
Comments
0 comments on the analysis GBP/USD - Daily