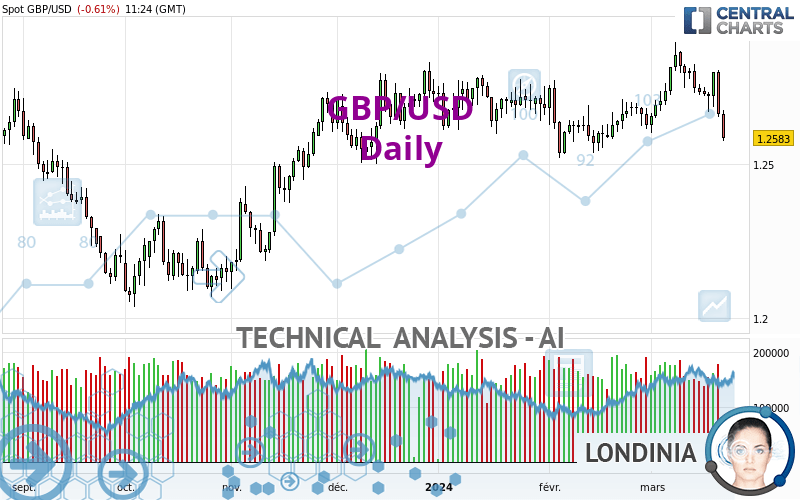
GBP/USD - Daily - Technical analysis published on 03/22/2024 (GMT)
- 127
- 0
Click here for a new analysis!
- Timeframe : Daily
- - Analysis generated on
- Status : TARGET REACHED

Summary of the analysis

Additional analysis
Quotes
GBP/USD rating 1.2583 USD. The price registered a decrease of -0.61% on the session and was between 1.2575 USD and 1.2675 USD. This implies that the price is at +0.06% from its lowest and at -0.73% from its highest.So that you have an overall view of the price change, here is a table showing the variations over several periods:
Near a new LOW record (1 year)
Type : Bearish
Timeframe : Weekly
Near a new HIGH record (1st january)
Type : Bullish
Timeframe : Weekly
Near a new HIGH record (1 month)
Type : Bullish
Timeframe : Weekly
New LOW record (1 month)
Type : Bearish
Timeframe : Weekly
Technical
A technical analysis in Daily of this GBP/USD chart shows a slightly bearish trend. 60.71% of the signals given by moving averages are bearish. This slightly bearish trend could be reinforced by the strong bearish signals given by short-term moving averages. An assessment of moving averages reveals several bearish signals that could impact this trend:
Bearish trend reversal : Moving Average 20
Type : Bearish
Timeframe : Daily
Bearish trend reversal : Moving Average 50
Type : Bearish
Timeframe : Daily
Bearish trend reversal : adaptative moving average 50
Type : Bearish
Timeframe : Daily
Bearish price crossover with Moving Average 100
Type : Bearish
Timeframe : Daily
Bearish price crossover with adaptative moving average 50
Type : Bearish
Timeframe : Daily
Bearish price crossover with adaptative moving average 100
Type : Bearish
Timeframe : Daily
The technical indicators are generally neutral. They do not provide relevant information on the direction of future price movements.
Caution: the Central Indicators scanner currently detects an excess:
CCI indicator is oversold : under -100
Type : Neutral
Timeframe : Daily
Williams %R indicator is oversold : under -80
Type : Neutral
Timeframe : Daily
Pivot points : price is under support 1
Type : Neutral
Timeframe : Daily
Pivot points : price is under support 3
Type : Neutral
Timeframe : Weekly
Aroon indicator bearish trend
Type : Bearish
Timeframe : Daily
Ichimoku : price is under the cloud
Type : Bearish
Timeframe : Daily
SuperTrend indicator bearish reversal
Type : Bearish
Timeframe : Daily
Ichimoku - Bearish crossover : Tenkan & Kijun
Type : Bearish
Timeframe : Daily
An analysis of the price chart with the Central Patterns scanner (detector of chart patterns and resistances and supports) shows several results that can have an impact on the price change:
Near support of channel
Type : Bullish
Timeframe : Daily
Horizontal support is broken
Type : Bearish
Timeframe : Daily
The Central Candlesticks scanner, specialised in Japanese candlesticks, did not identify any signals.
| S3 | S2 | S1 | Price | R1 | R2 | R3 | |
|---|---|---|---|---|---|---|---|
| ProTrendLines | 1.2315 | 1.2418 | 1.2539 | 1.2583 | 1.2621 | 1.2800 | 1.2927 |
| Change (%) | -2.13% | -1.31% | -0.35% | - | +0.30% | +1.72% | +2.73% |
| Change | -0.0268 | -0.0165 | -0.0044 | - | +0.0038 | +0.0217 | +0.0344 |
| Level | Minor | Minor | Intermediate | - | Intermediate | Major | Minor |
Attention could also be paid to pivot points to set price objectives:
| Pivot points | S3 | S2 | S1 | PP | R1 | R2 | R3 |
|---|---|---|---|---|---|---|---|
| Standard | 1.2453 | 1.2551 | 1.2606 | 1.2704 | 1.2759 | 1.2857 | 1.2912 |
| Camarilla | 1.2618 | 1.2632 | 1.2646 | 1.2660 | 1.2674 | 1.2688 | 1.2702 |
| Woodie | 1.2431 | 1.2540 | 1.2584 | 1.2693 | 1.2737 | 1.2846 | 1.2890 |
| Fibonacci | 1.2551 | 1.2610 | 1.2646 | 1.2704 | 1.2763 | 1.2799 | 1.2857 |
| Pivot points | S3 | S2 | S1 | PP | R1 | R2 | R3 |
|---|---|---|---|---|---|---|---|
| Standard | 1.2542 | 1.2633 | 1.2682 | 1.2773 | 1.2822 | 1.2913 | 1.2962 |
| Camarilla | 1.2693 | 1.2705 | 1.2718 | 1.2731 | 1.2744 | 1.2757 | 1.2770 |
| Woodie | 1.2521 | 1.2623 | 1.2661 | 1.2763 | 1.2801 | 1.2903 | 1.2941 |
| Fibonacci | 1.2633 | 1.2687 | 1.2720 | 1.2773 | 1.2827 | 1.2860 | 1.2913 |
| Pivot points | S3 | S2 | S1 | PP | R1 | R2 | R3 |
|---|---|---|---|---|---|---|---|
| Standard | 1.2252 | 1.2385 | 1.2506 | 1.2639 | 1.2760 | 1.2893 | 1.3014 |
| Camarilla | 1.2557 | 1.2580 | 1.2604 | 1.2627 | 1.2650 | 1.2674 | 1.2697 |
| Woodie | 1.2246 | 1.2382 | 1.2500 | 1.2636 | 1.2754 | 1.2890 | 1.3008 |
| Fibonacci | 1.2385 | 1.2482 | 1.2542 | 1.2639 | 1.2736 | 1.2796 | 1.2893 |
Numerical data
The following are the details of the technical indicators and moving averages that were collected to generate this technical analysis:
| RSI (14): | 38.36 | |
| MACD (12,26,9): | 0.0006 | |
| Directional Movement: | -5.4724 | |
| AROON (14): | -71.4286 | |
| DEMA (21): | 1.2725 | |
| Parabolic SAR (0,02-0,02-0,2): | 1.2860 | |
| Elder Ray (13): | -0.0088 | |
| Super Trend (3,10): | 1.2863 | |
| Zig ZAG (10): | 1.2585 | |
| VORTEX (21): | 0.9751 | |
| Stochastique (14,3,5): | 25.14 | |
| TEMA (21): | 1.2717 | |
| Williams %R (14): | -97.18 | |
| Chande Momentum Oscillator (20): | -0.0152 | |
| Repulse (5,40,3): | -1.3806 | |
| ROCnROLL: | 2 | |
| TRIX (15,9): | 0.0280 | |
| Courbe Coppock: | 0.37 |
| MA7: | 1.2709 | |
| MA20: | 1.2724 | |
| MA50: | 1.2682 | |
| MA100: | 1.2631 | |
| MAexp7: | 1.2696 | |
| MAexp20: | 1.2711 | |
| MAexp50: | 1.2683 | |
| MAexp100: | 1.2633 | |
| Price / MA7: | -0.99% | |
| Price / MA20: | -1.11% | |
| Price / MA50: | -0.78% | |
| Price / MA100: | -0.38% | |
| Price / MAexp7: | -0.89% | |
| Price / MAexp20: | -1.01% | |
| Price / MAexp50: | -0.79% | |
| Price / MAexp100: | -0.40% |
News
The latest news and videos published on GBP/USD at the time of the analysis were as follows:
-
 Trading the trend: long GBP/USD
-
Technical Analysis: 19/03/2024 - GBPUSD retreats towards 50-day SMA
-
Technical Analysis: 05/03/2024 - GBPUSD battles with SMAs within sideways channel
-
Fun Fact Friday: Why is GBPUSD called cable?
-
Technical Analysis: 23/02/2024 - GBPUSD tries to strengthen bullish move above SMAs
About author

Online


Add a comment
Comments
0 comments on the analysis GBP/USD - Daily