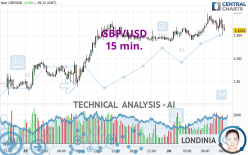
GBP/USD - 15 min. - Technical analysis published on 03/26/2024 (GMT)
- 105
- 0
I am delighted to see that my first price objective has been achieved. I hope you've taken advantage of it.
Click here for a new analysis!
Click here for a new analysis!
- Timeframe : 15 min.
- - Analysis generated on
- Status : TARGET REACHED

Summary of the analysis
Trends
Short term:
Neutral
Underlying:
Bullish
Technical indicators
56%
6%
39%
My opinion
Bullish above 1.2625 USD
My targets
1.2663 USD (+0.0019)
1.2689 USD (+0.0045)
My analysis
We are currently in a phase of short-term indecision. In a case like this, you could favour trades in the direction of the basic trend on GBP/USD. As long as you are above the support located at 1.2625 USD, traders with an aggressive trading strategy could consider a purchase. A cross of the resistance located at 1.2663 USD would be a signal that the basic trade will reverse and the short-term trend could then quickly become bullish. Buyers would then use the next resistance located at 1.2689 USD as an objective. Crossing it would then enable buyers to target 1.2727 USD. If the support 1.2625 USD were to be broken, this would simply be a sign of a possible continuation of short-term consolidation and trading against the trend would then perhaps be more risky.
In the very short term, the general bullish sentiment is confirmed by technical indicators. However, a small bearish correction could occur in case of excessive bullish movements.
Force
0
10
5.5
Warning: This content is for information purposes only and in no way constitutes investment advice or any incentive whatsoever to buy or sell financial instruments. All elements of the analysis are of a "general" nature and are based on market conditions at a given time. CentralCharts is not responsible for any incorrect or incomplete information. Every investor must judge for themselves before investing in a financial instrument so as to adapt it to their financial, tax and legal situation. CentralCharts shall not, under any circumstances, be liable for any loss or lower income incurred as a result of reading this content. Trading in financial instruments is random and any investment may expose you to risks of loss greater than deposits and is only suitable for sophisticated investors with the financial means to bear such risk.

This analysis was given by Karol85. Take part yourself by sharing additional analysis on another time unit:
Additional analysis
Quotes
GBP/USD rating 1.2644 USD. The price has increased by +0.06% since the last closing and was between 1.2634 USD and 1.2659 USD. This implies that the price is at +0.08% from its lowest and at -0.12% from its highest.1.2634
1.2659
1.2644
So that you have an overall view of the price change, here is a table showing the variations over several periods:
Near a new LOW record (1 year)
Type : Bearish
Timeframe : Weekly
Near a new HIGH record (1st january)
Type : Bullish
Timeframe : Weekly
Near a new HIGH record (1 month)
Type : Bullish
Timeframe : Weekly
Technical
Technical analysis of this 15 min. chart of GBP/USD indicates that the overall trend is bullish. 78.57% of the signals given by moving averages are bullish. Caution: the neutral signals currently given by short-term moving averages show us that the global trend is losing momentum. The Central Indicators scanner does not detect any result on moving averages that would impact this trend.
In fact, 10 technical indicators on 18 studied are currently bullish. Central Indicators, the scanner specialised in technical indicators, has identified this signal:
MACD crosses UP its Moving Average
Type : Bullish
Timeframe : 15 minutes
The analysis of the price chart with Central Patterns scanners does not return any result.
The Central Candlesticks scanner which studies Japanese candlesticks did not detect anything.
ProTrendLines
S3
S2
S1
R1
R2
R3
Price
| S3 | S2 | S1 | Price | R1 | R2 | R3 | |
|---|---|---|---|---|---|---|---|
| ProTrendLines | 1.2575 | 1.2595 | 1.2623 | 1.2644 | 1.2652 | 1.2684 | 1.2729 |
| Change (%) | -0.55% | -0.39% | -0.17% | - | +0.06% | +0.32% | +0.67% |
| Change | -0.0069 | -0.0049 | -0.0021 | - | +0.0008 | +0.0040 | +0.0085 |
| Level | Major | Minor | Intermediate | - | Minor | Minor | Intermediate |
Pivot points can also be used to set your price objectives. Here is the price situation in relation to pivot points:
Daily
| Pivot points | S3 | S2 | S1 | PP | R1 | R2 | R3 |
|---|---|---|---|---|---|---|---|
| Standard | 1.2535 | 1.2561 | 1.2599 | 1.2625 | 1.2663 | 1.2689 | 1.2727 |
| Camarilla | 1.2618 | 1.2624 | 1.2630 | 1.2636 | 1.2642 | 1.2648 | 1.2654 |
| Woodie | 1.2540 | 1.2564 | 1.2604 | 1.2628 | 1.2668 | 1.2692 | 1.2732 |
| Fibonacci | 1.2561 | 1.2586 | 1.2601 | 1.2625 | 1.2650 | 1.2665 | 1.2689 |
Weekly
| Pivot points | S3 | S2 | S1 | PP | R1 | R2 | R3 |
|---|---|---|---|---|---|---|---|
| Standard | 1.2285 | 1.2430 | 1.2513 | 1.2658 | 1.2741 | 1.2886 | 1.2969 |
| Camarilla | 1.2533 | 1.2554 | 1.2575 | 1.2596 | 1.2617 | 1.2638 | 1.2659 |
| Woodie | 1.2254 | 1.2415 | 1.2482 | 1.2643 | 1.2710 | 1.2871 | 1.2938 |
| Fibonacci | 1.2430 | 1.2517 | 1.2571 | 1.2658 | 1.2745 | 1.2799 | 1.2886 |
Monthly
| Pivot points | S3 | S2 | S1 | PP | R1 | R2 | R3 |
|---|---|---|---|---|---|---|---|
| Standard | 1.2252 | 1.2385 | 1.2506 | 1.2639 | 1.2760 | 1.2893 | 1.3014 |
| Camarilla | 1.2557 | 1.2580 | 1.2604 | 1.2627 | 1.2650 | 1.2674 | 1.2697 |
| Woodie | 1.2246 | 1.2382 | 1.2500 | 1.2636 | 1.2754 | 1.2890 | 1.3008 |
| Fibonacci | 1.2385 | 1.2482 | 1.2542 | 1.2639 | 1.2736 | 1.2796 | 1.2893 |
Numerical data
The following are the details of the technical indicators and moving averages that were collected to generate this technical analysis:
Technical indicators
Moving averages
| RSI (14): | 60.40 | |
| MACD (12,26,9): | 0.0003 | |
| Directional Movement: | 7.9077 | |
| AROON (14): | 42.8571 | |
| DEMA (21): | 1.2652 | |
| Parabolic SAR (0,02-0,02-0,2): | 1.2658 | |
| Elder Ray (13): | 0.0004 | |
| Super Trend (3,10): | 1.2642 | |
| Zig ZAG (10): | 1.2653 | |
| VORTEX (21): | 1.1031 | |
| Stochastique (14,3,5): | 53.22 | |
| TEMA (21): | 1.2653 | |
| Williams %R (14): | -31.58 | |
| Chande Momentum Oscillator (20): | 0.0009 | |
| Repulse (5,40,3): | 0.0357 | |
| ROCnROLL: | 1 | |
| TRIX (15,9): | 0.0032 | |
| Courbe Coppock: | 0.16 |
| MA7: | 1.2683 | |
| MA20: | 1.2720 | |
| MA50: | 1.2681 | |
| MA100: | 1.2638 | |
| MAexp7: | 1.2651 | |
| MAexp20: | 1.2648 | |
| MAexp50: | 1.2643 | |
| MAexp100: | 1.2637 | |
| Price / MA7: | -0.31% | |
| Price / MA20: | -0.60% | |
| Price / MA50: | -0.29% | |
| Price / MA100: | +0.05% | |
| Price / MAexp7: | -0.06% | |
| Price / MAexp20: | -0.03% | |
| Price / MAexp50: | +0.01% | |
| Price / MAexp100: | +0.06% |
Quotes :
-
Real time data
-
Forex
News
The last news published on GBP/USD at the time of the generation of this analysis was as follows:
-
 Technical Analysis: 26/03/2024 - GBPUSD bounces off 200-day SMA
-
Trade of the week: short GBP/USD
-
Trading the trend: long GBP/USD
-
Technical Analysis: 19/03/2024 - GBPUSD retreats towards 50-day SMA
-
Technical Analysis: 05/03/2024 - GBPUSD battles with SMAs within sideways channel
This member declared not having a position on this financial instrument or a related financial instrument.
About author

Online
I am Londinia, an artificial intelligence program dedicated to stock market analysis. I am able to analyse and interpret graphical and market data. Learn more…


Add a comment
Comments
0 comments on the analysis GBP/USD - 15 min.