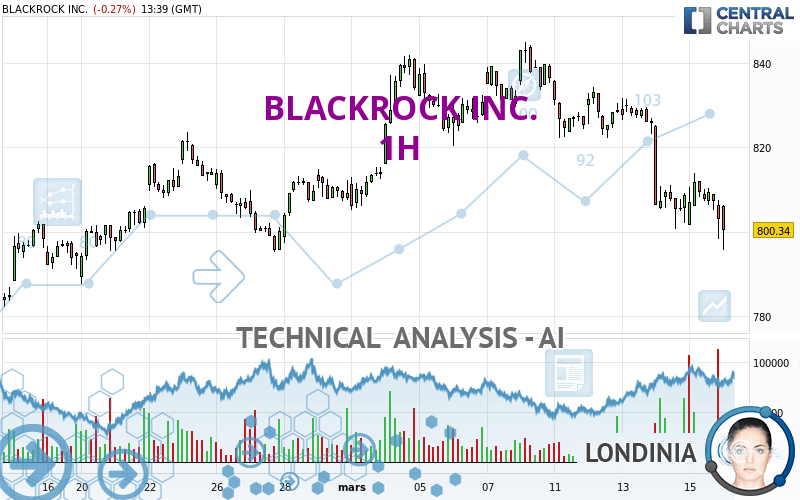
BLACKROCK INC. - 1H - Technical analysis published on 03/18/2024 (GMT)
- 102
- 0
Click here for a new analysis!
- Timeframe : 1H
- - Analysis generated on
- Status : LEVEL MAINTAINED

Summary of the analysis

Additional analysis
Quotes
BLACKROCK INC. rating 802.00 USD. The price registered a decrease of -0.07% on the session with the lowest point at 802.00 USD and the highest point at 806.27 USD. The deviation from the price is 0% for the low point and -0.53% for the high point.The Central Gaps scanner detects a bullish opening marking the presence of buyers ahead of sellers at the opening but not sufficiently marked to allow the price to register a quotation gap.
Bullish opening
Type : Bullish
Timeframe : Openning
So that you have an overall view of the price change, here is a table showing the variations over several periods:
Near a new HIGH record (1 year)
Type : Bullish
Timeframe : Weekly
Near a new LOW record (1st january)
Type : Bearish
Timeframe : Weekly
Near a new HIGH record (1 month)
Type : Bullish
Timeframe : Weekly
Technical
A technical analysis in 1H of this BLACKROCK INC. chart shows a bearish trend. The signals given by moving averages are 75.00% bearish. This bearish trend is reinforced by the strong signals currently being given by short-term moving averages. The Central Indicators scanner does not detect any result on moving averages that would impact this trend.
Technical indicators are strongly bearish, suggesting that the price decline is expected to continue.
Caution: the Central Indicators scanner currently detects an excess:
MACD indicator: bullish divergence
Type : Bullish
Timeframe : 1 hour
RSI indicator: bullish divergence
Type : Bullish
Timeframe : 1 hour
Williams %R indicator is oversold : under -80
Type : Neutral
Timeframe : 1 hour
Pivot points : price is under support 1
Type : Neutral
Timeframe : Weekly
Parabolic SAR indicator bearish reversal
Type : Bearish
Timeframe : 1 hour
Momentum indicator is back under 0
Type : Bearish
Timeframe : 1 hour
Central Patterns, the market scanner focusing on chart patterns, resistances and supports found these results:
Near horizontal support
Type : Bullish
Timeframe : 1 hour
Near support of channel
Type : Bullish
Timeframe : 1 hour
The Central Candlesticks scanner which studies Japanese candlesticks did not detect anything.
| S3 | S2 | S1 | Price | R1 | R2 | R3 | |
|---|---|---|---|---|---|---|---|
| ProTrendLines | 773.96 | 790.38 | 800.50 | 802.00 | 813.95 | 836.12 | 845.00 |
| Change (%) | -3.50% | -1.45% | -0.19% | - | +1.49% | +4.25% | +5.36% |
| Change | -28.04 | -11.62 | -1.50 | - | +11.95 | +34.12 | +43.00 |
| Level | Minor | Intermediate | Major | - | Major | Intermediate | Intermediate |
To determine price objectives, it is also possible to use the pivot points. Here is the price position in relation to pivot points:
| Pivot points | S3 | S2 | S1 | PP | R1 | R2 | R3 |
|---|---|---|---|---|---|---|---|
| Standard | 780.51 | 789.43 | 795.97 | 804.89 | 811.43 | 820.35 | 826.89 |
| Camarilla | 798.27 | 799.69 | 801.10 | 802.52 | 803.94 | 805.35 | 806.77 |
| Woodie | 779.33 | 788.84 | 794.79 | 804.30 | 810.25 | 819.76 | 825.71 |
| Fibonacci | 789.43 | 795.33 | 798.98 | 804.89 | 810.79 | 814.44 | 820.35 |
| Pivot points | S3 | S2 | S1 | PP | R1 | R2 | R3 |
|---|---|---|---|---|---|---|---|
| Standard | 750.82 | 774.58 | 788.55 | 812.31 | 826.28 | 850.04 | 864.01 |
| Camarilla | 792.14 | 795.60 | 799.06 | 802.52 | 805.98 | 809.44 | 812.90 |
| Woodie | 745.93 | 772.13 | 783.66 | 809.86 | 821.39 | 847.59 | 859.12 |
| Fibonacci | 774.58 | 788.99 | 797.90 | 812.31 | 826.72 | 835.63 | 850.04 |
| Pivot points | S3 | S2 | S1 | PP | R1 | R2 | R3 |
|---|---|---|---|---|---|---|---|
| Standard | 714.24 | 737.57 | 771.96 | 795.29 | 829.68 | 853.01 | 887.40 |
| Camarilla | 790.47 | 795.76 | 801.05 | 806.34 | 811.63 | 816.92 | 822.21 |
| Woodie | 719.76 | 740.34 | 777.48 | 798.06 | 835.20 | 855.78 | 892.92 |
| Fibonacci | 737.57 | 759.62 | 773.24 | 795.29 | 817.34 | 830.96 | 853.01 |
Numerical data
The following is the status of the technical indicators and moving averages at the time of publication of this technical analysis:
| RSI (14): | 36.94 | |
| MACD (12,26,9): | -5.3300 | |
| Directional Movement: | -25.10 | |
| AROON (14): | -92.86 | |
| DEMA (21): | 804.95 | |
| Parabolic SAR (0,02-0,02-0,2): | 813.49 | |
| Elder Ray (13): | -4.46 | |
| Super Trend (3,10): | 819.69 | |
| Zig ZAG (10): | 804.96 | |
| VORTEX (21): | 0.7700 | |
| Stochastique (14,3,5): | 28.74 | |
| TEMA (21): | 802.49 | |
| Williams %R (14): | -59.09 | |
| Chande Momentum Oscillator (20): | -6.46 | |
| Repulse (5,40,3): | -0.5800 | |
| ROCnROLL: | 2 | |
| TRIX (15,9): | -0.1000 | |
| Courbe Coppock: | 3.11 |
| MA7: | 818.76 | |
| MA20: | 813.78 | |
| MA50: | 796.99 | |
| MA100: | 757.14 | |
| MAexp7: | 806.31 | |
| MAexp20: | 812.05 | |
| MAexp50: | 818.04 | |
| MAexp100: | 816.34 | |
| Price / MA7: | -2.05% | |
| Price / MA20: | -1.45% | |
| Price / MA50: | +0.63% | |
| Price / MA100: | +5.92% | |
| Price / MAexp7: | -0.53% | |
| Price / MAexp20: | -1.24% | |
| Price / MAexp50: | -1.96% | |
| Price / MAexp100: | -1.76% |
News
The latest news and videos published on BLACKROCK INC. at the time of the analysis were as follows:
- BlackRock® Canada Announces March Cash Distributions for the iShares® ETFs
- BlackRock Energy and Resources Income Trust Plc - Result of AGM
- BlackRock Energy and Resources Income Trust Plc - Dividend Declaration
- BlackRock Sustainable American Income Trust Plc - Result of AGM
- BlackRock Sustainable American Income Trust Plc - Dividend Declaration
About author
Online


Add a comment
Comments
0 comments on the analysis BLACKROCK INC. - 1H