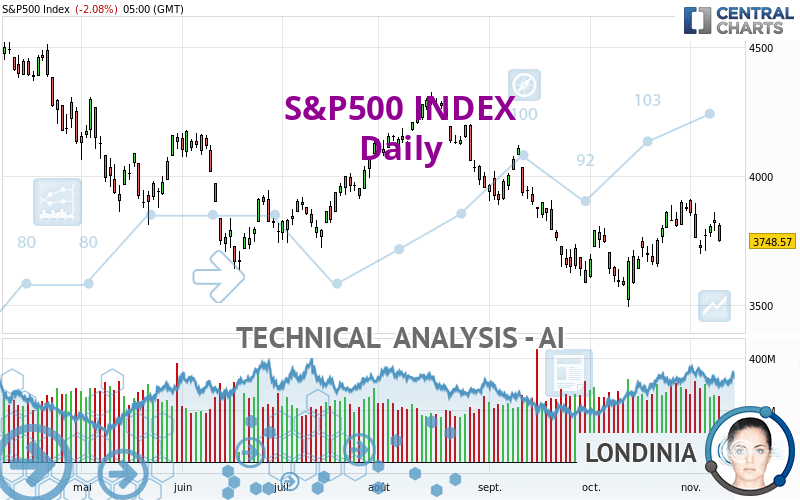
S&P500 INDEX - Daily - Technical analysis published on 11/10/2022 (GMT)
- 158
- 0
Click here for a new analysis!
- Timeframe : Daily
- - Analysis generated on
- Status : INVALID

Summary of the analysis

Additional analysis
Quotes
The S&P500 INDEX price is 3,748.57 USD. The price is lower by -2.08% since the last closing and was traded between 3,744.22 USD and 3,818.20 USD over the period. The price is currently at +0.12% from its lowest and -1.82% from its highest.A bearish opening was detected by the Central Gaps scanner. Sellers are trying to impose a bearish trend in the very short term.
Bearish opening
Type : Bearish
Timeframe : Openning
A study of price movements over other periods shows the following variations:
Near a new HIGH record (1 month)
Type : Bullish
Timeframe : Weekly
Technical
Technical analysis of this Daily chart of S&P500 INDEX indicates that the overall trend is bearish. 78.57% of the signals given by moving averages are bearish. The overall trend seems to be showing some signs of weakness, as do the tentative bearish signals from short-term moving averages. The Central Indicators scanner detects bearish signals on moving averages that could impact this trend:
Bearish price crossover with Moving Average 20
Type : Bearish
Timeframe : Daily
Bearish price crossover with Moving Average 50
Type : Bearish
Timeframe : Daily
Bearish price crossover with adaptative moving average 20
Type : Bearish
Timeframe : Daily
An assessment of technical indicators does not currently provide any relevant information to suggest whether the signal given by the technical indicators is more bullish or bearish.
Caution: the Central Indicators scanner currently detects an excess:
MACD indicator: bearish divergence
Type : Bearish
Timeframe : Daily
Pivot points : price is under support 3
Type : Neutral
Timeframe : Daily
RSI indicator is back under 50
Type : Bearish
Timeframe : Daily
Ichimoku : price is under the cloud
Type : Bearish
Timeframe : Daily
Momentum indicator is back under 0
Type : Bearish
Timeframe : Daily
Williams %R indicator is back under -50
Type : Bearish
Timeframe : Daily
The analysis of the price chart with Central Patterns scanners does not return any result.
The presence of a bearish pattern in Japanese candlesticks detected by Central Candlesticks that could cause a correction in the very short term was also detected:
Black evening star
Type : Bearish
Timeframe : Daily
| S3 | S2 | S1 | Price | R1 | R2 | R3 | |
|---|---|---|---|---|---|---|---|
| ProTrendLines | 3,386.15 | 3,578.75 | 3,666.77 | 3,748.57 | 3,900.79 | 4,172.77 | 4,305.38 |
| Change (%) | -9.67% | -4.53% | -2.18% | - | +4.06% | +11.32% | +14.85% |
| Change | -362.42 | -169.82 | -81.80 | - | +152.22 | +424.20 | +556.81 |
| Level | Intermediate | Major | Major | - | Major | Intermediate | Major |
Pivot points can also be used to set your price objectives. Here is the price situation in relation to pivot points:
| Pivot points | S3 | S2 | S1 | PP | R1 | R2 | R3 |
|---|---|---|---|---|---|---|---|
| Standard | 3,648.48 | 3,696.35 | 3,722.46 | 3,770.33 | 3,796.44 | 3,844.31 | 3,870.42 |
| Camarilla | 3,728.23 | 3,735.01 | 3,741.79 | 3,748.57 | 3,755.35 | 3,762.13 | 3,768.92 |
| Woodie | 3,637.60 | 3,690.91 | 3,711.58 | 3,764.89 | 3,785.56 | 3,838.87 | 3,859.54 |
| Fibonacci | 3,696.35 | 3,724.61 | 3,742.07 | 3,770.33 | 3,798.59 | 3,816.05 | 3,844.31 |
| Pivot points | S3 | S2 | S1 | PP | R1 | R2 | R3 |
|---|---|---|---|---|---|---|---|
| Standard | 3,461.56 | 3,579.86 | 3,675.20 | 3,793.50 | 3,888.84 | 4,007.14 | 4,102.48 |
| Camarilla | 3,711.80 | 3,731.38 | 3,750.97 | 3,770.55 | 3,790.13 | 3,809.72 | 3,829.30 |
| Woodie | 3,450.09 | 3,574.12 | 3,663.73 | 3,787.76 | 3,877.37 | 4,001.40 | 4,091.01 |
| Fibonacci | 3,579.86 | 3,661.47 | 3,711.89 | 3,793.50 | 3,875.11 | 3,925.53 | 4,007.14 |
| Pivot points | S3 | S2 | S1 | PP | R1 | R2 | R3 |
|---|---|---|---|---|---|---|---|
| Standard | 3,193.39 | 3,342.49 | 3,607.23 | 3,756.33 | 4,021.07 | 4,170.17 | 4,434.91 |
| Camarilla | 3,758.17 | 3,796.11 | 3,834.05 | 3,871.98 | 3,909.92 | 3,947.85 | 3,985.79 |
| Woodie | 3,251.22 | 3,371.40 | 3,665.06 | 3,785.24 | 4,078.90 | 4,199.08 | 4,492.74 |
| Fibonacci | 3,342.49 | 3,500.57 | 3,598.24 | 3,756.33 | 3,914.41 | 4,012.08 | 4,170.17 |
Numerical data
The following is the status of technical indicators and moving averages registered at the time this technical analysis was created:
| RSI (14): | 47.67 | |
| MACD (12,26,9): | 6.4700 | |
| Directional Movement: | -2.64 | |
| AROON (14): | 50.00 | |
| DEMA (21): | 3,780.02 | |
| Parabolic SAR (0,02-0,02-0,2): | 3,895.20 | |
| Elder Ray (13): | -2.50 | |
| Super Trend (3,10): | 3,642.70 | |
| Zig ZAG (10): | 3,748.57 | |
| VORTEX (21): | 1.0600 | |
| Stochastique (14,3,5): | 55.63 | |
| TEMA (21): | 3,816.20 | |
| Williams %R (14): | -61.74 | |
| Chande Momentum Oscillator (20): | -48.77 | |
| Repulse (5,40,3): | -2.0000 | |
| ROCnROLL: | 2 | |
| TRIX (15,9): | 0.0200 | |
| Courbe Coppock: | 5.16 |
| MA7: | 3,784.24 | |
| MA20: | 3,766.09 | |
| MA50: | 3,791.05 | |
| MA100: | 3,900.37 | |
| MAexp7: | 3,787.52 | |
| MAexp20: | 3,777.37 | |
| MAexp50: | 3,812.96 | |
| MAexp100: | 3,903.57 | |
| Price / MA7: | -0.94% | |
| Price / MA20: | -0.47% | |
| Price / MA50: | -1.12% | |
| Price / MA100: | -3.89% | |
| Price / MAexp7: | -1.03% | |
| Price / MAexp20: | -0.76% | |
| Price / MAexp50: | -1.69% | |
| Price / MAexp100: | -3.97% |
News
Don't forget to follow the news on S&P500 INDEX. At the time of publication of this analysis, the latest news was as follows:
-
 Ford Motor Tops SP-500 Performance List by FX Empire
-
US Dollar Charges Through Resistance: Does It Continue and Will SPX Find Its Own Break?
-
SP500 Recovers Early Losses, Dow Trades Flat
-
SP 500 and NASDAQ 100 Forecast July 23, 2021
-
SP 500 and NASDAQ 100 Forecast April 14, 2021
About author

Online


Add a comment
Comments
0 comments on the analysis S&P500 INDEX - Daily