S&P500 INDEX - Recorded an All-Time High and Surpassed 161.8% Fibonacci Extension Level - 10/06/2017 (GMT)
- Who voted?
- 674
- 0
- Timeframe : Daily

S&P500 INDEX Chart
Are you looking for opportunities in indices and forex?
DISCOVER LONDINIA OPPORTUNITIES...
DISCOVER LONDINIA OPPORTUNITIES...
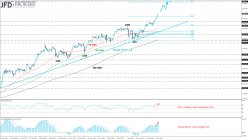
The S&P 500 index soared to a fresh all-time high once again, near the 2552 price level and recorded the eighth consecutive bullish day. The price is developing within an ascending move over the last ten months and surged more than 16% since then. Moreover, the price successfully surpassed the 161.8% Fibonacci extension level of the last small correction with high at 2490 and low at 2417.
From the technical point of view, on the daily timeframe, the three simple moving averages (50, 100 and 200) are sloping to the upside endorsing the upward movement. The RSI indicator jumped above the 70 level and entered the overbought zone, whilst the MACD oscillator rose above the trigger line and is strengthening its momentum.
From the technical point of view, on the daily timeframe, the three simple moving averages (50, 100 and 200) are sloping to the upside endorsing the upward movement. The RSI indicator jumped above the 70 level and entered the overbought zone, whilst the MACD oscillator rose above the trigger line and is strengthening its momentum.
This member declared not having a position on this financial instrument or a related financial instrument.
About author

Offline


Add a comment
Comments
0 comments on the analysis S&P500 INDEX - Daily