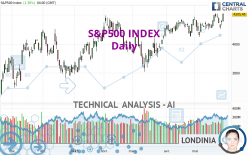
S&P500 INDEX - Daily - Technical analysis published on 05/30/2023 (GMT)
- 117
- 0
I am delighted to see that my first price objective has been achieved. I hope you've taken advantage of it.
Click here for a new analysis!
Click here for a new analysis!
- Timeframe : Daily
- - Analysis generated on
- Status : TARGET REACHED

Summary of the analysis
Trends
Short term:
Strongly bullish
Underlying:
Strongly bullish
Technical indicators
78%
0%
22%
My opinion
Bullish above 4,110.07 USD
My targets
4,305.20 USD (+2.37%)
4,330.62 USD (+2.98%)
My analysis
S&P500 INDEX is part of a very strong bullish trend. Traders may consider trading only long positions (at the time of purchase) as long as the price remains well above 4,110.07 USD. The next resistance located at 4,305.20 USD is the next bullish objective to be reached. A bullish break in this resistance would boost the bullish momentum. The bullish movement could then continue towards the next resistance located at 4,330.62 USD. After this resistance, buyers could then target 4,796.56 USD. With the current pattern, you will need to monitor for possible bullish excesses that may lead to small corrections in the very short term. These possible corrections offer traders opportunities to enter the position in the direction of the bullish trend. Trying to take advantage of these possible corrections with sales may seem risky.
Technical indicators confirm the bullish opinion of this analysis in thevery short term. However, be careful of excessive bullish movements. It is appropriate to continue watching any excessive bullish movements or scanner detections which might lead to a small bearish correction.
Force
0
10
8.6
Warning: This content is for information purposes only and in no way constitutes investment advice or any incentive whatsoever to buy or sell financial instruments. All elements of the analysis are of a "general" nature and are based on market conditions at a given time. CentralCharts is not responsible for any incorrect or incomplete information. Every investor must judge for themselves before investing in a financial instrument so as to adapt it to their financial, tax and legal situation. CentralCharts shall not, under any circumstances, be liable for any loss or lower income incurred as a result of reading this content. Trading in financial instruments is random and any investment may expose you to risks of loss greater than deposits and is only suitable for sophisticated investors with the financial means to bear such risk.

This analysis was given by althani. Take part yourself by sharing additional analysis on another time unit:
Additional analysis
Quotes
The S&P500 INDEX rating is 4,205.45 USD. The price has increased by +1.31% since the last closing and was traded between 4,156.16 USD and 4,212.87 USD over the period. The price is currently at +1.19% from its lowest and -0.18% from its highest.4,156.16
4,212.87
4,205.45
A bullish gap was detected at the opening by the Central Gaps scanner. There are a lot of buyers and they have the upper hand in the very short term.
Opening Gap UP
Type : Bullish
Timeframe : Openning
So that you have an overall view of the price change, here is a table showing the variations over several periods:
Near a new HIGH record (1 year)
Type : Bullish
Timeframe : Weekly
New HIGH record (1st january)
Type : Bullish
Timeframe : Weekly
New HIGH record (1 month)
Type : Bullish
Timeframe : Weekly
Technical
A technical analysis in Daily of this S&P500 INDEX chart shows a strongly bullish trend. The signals given by the moving averages are 92.86% bullish. This strong bullish trend is confirmed by the strong signals currently being given by short-term moving averages. The Central Indicators market scanner currently does not detect any result that concerns moving averages.
In fact, 14 technical indicators on 18 studied are currently positioned bullish. Caution: the Central Indicators scanner currently detects an excess:
CCI indicator is overbought : over 100
Type : Neutral
Timeframe : Daily
Williams %R indicator is overbought : over -20
Type : Neutral
Timeframe : Daily
No signals are given by Central Patterns, a market scanner specialised in chart patterns, resistances and supports.
The Central Candlesticks scanner, specialised in Japanese candlesticks, did not identify any signals.
ProTrendLines
S3
S2
S1
R1
R2
Price
| S3 | S2 | S1 | Price | R1 | R2 | |
|---|---|---|---|---|---|---|
| ProTrendLines | 3,855.76 | 3,994.98 | 4,110.07 | 4,205.45 | 4,305.20 | 4,796.56 |
| Change (%) | -8.32% | -5.00% | -2.27% | - | +2.37% | +14.06% |
| Change | -349.69 | -210.47 | -95.38 | - | +99.75 | +591.11 |
| Level | Intermediate | Minor | Major | - | Major | Major |
Attention could also be paid to pivot points to set price objectives:
Daily
| Pivot points | S3 | S2 | S1 | PP | R1 | R2 | R3 |
|---|---|---|---|---|---|---|---|
| Standard | 4,149.18 | 4,170.68 | 4,188.10 | 4,209.60 | 4,227.02 | 4,248.52 | 4,265.94 |
| Camarilla | 4,194.82 | 4,198.39 | 4,201.95 | 4,205.52 | 4,209.09 | 4,212.66 | 4,216.22 |
| Woodie | 4,147.14 | 4,169.66 | 4,186.06 | 4,208.58 | 4,224.98 | 4,247.50 | 4,263.90 |
| Fibonacci | 4,170.68 | 4,185.55 | 4,194.73 | 4,209.60 | 4,224.47 | 4,233.65 | 4,248.52 |
Weekly
| Pivot points | S3 | S2 | S1 | PP | R1 | R2 | R3 |
|---|---|---|---|---|---|---|---|
| Standard | 4,149.18 | 4,170.68 | 4,188.10 | 4,209.60 | 4,227.02 | 4,248.52 | 4,265.94 |
| Camarilla | 4,194.82 | 4,198.39 | 4,201.95 | 4,205.52 | 4,209.09 | 4,212.66 | 4,216.22 |
| Woodie | 4,147.14 | 4,169.66 | 4,186.06 | 4,208.58 | 4,224.98 | 4,247.50 | 4,263.90 |
| Fibonacci | 4,170.68 | 4,185.55 | 4,194.73 | 4,209.60 | 4,224.47 | 4,233.65 | 4,248.52 |
Monthly
| Pivot points | S3 | S2 | S1 | PP | R1 | R2 | R3 |
|---|---|---|---|---|---|---|---|
| Standard | 3,968.49 | 4,008.92 | 4,089.20 | 4,129.63 | 4,209.91 | 4,250.34 | 4,330.62 |
| Camarilla | 4,136.29 | 4,147.35 | 4,158.42 | 4,169.48 | 4,180.55 | 4,191.61 | 4,202.68 |
| Woodie | 3,988.42 | 4,018.88 | 4,109.13 | 4,139.59 | 4,229.84 | 4,260.30 | 4,350.55 |
| Fibonacci | 4,008.92 | 4,055.03 | 4,083.52 | 4,129.63 | 4,175.74 | 4,204.23 | 4,250.34 |
Numerical data
The following are the details of the technical indicators and moving averages that were collected to generate this technical analysis:
Technical indicators
Moving averages
| RSI (14): | 59.44 | |
| MACD (12,26,9): | 21.4600 | |
| Directional Movement: | 14.91 | |
| AROON (14): | 92.86 | |
| DEMA (21): | 4,179.57 | |
| Parabolic SAR (0,02-0,02-0,2): | 4,105.13 | |
| Elder Ray (13): | 49.23 | |
| Super Trend (3,10): | 4,079.36 | |
| Zig ZAG (10): | 4,205.52 | |
| VORTEX (21): | 1.0100 | |
| Stochastique (14,3,5): | 73.35 | |
| TEMA (21): | 4,181.31 | |
| Williams %R (14): | -19.35 | |
| Chande Momentum Oscillator (20): | 74.90 | |
| Repulse (5,40,3): | 0.2000 | |
| ROCnROLL: | 1 | |
| TRIX (15,9): | 0.0600 | |
| Courbe Coppock: | 2.52 |
| MA7: | 4,172.53 | |
| MA20: | 4,143.41 | |
| MA50: | 4,105.83 | |
| MA100: | 4,056.72 | |
| MAexp7: | 4,174.68 | |
| MAexp20: | 4,151.47 | |
| MAexp50: | 4,110.87 | |
| MAexp100: | 4,063.79 | |
| Price / MA7: | +0.79% | |
| Price / MA20: | +1.50% | |
| Price / MA50: | +2.43% | |
| Price / MA100: | +3.67% | |
| Price / MAexp7: | +0.74% | |
| Price / MAexp20: | +1.30% | |
| Price / MAexp50: | +2.30% | |
| Price / MAexp100: | +3.49% |
Quotes :
-
End-of-day data
-
S&P Base Indices
News
Don't forget to follow the news on S&P500 INDEX. At the time of publication of this analysis, the latest news was as follows:
-
 XTB Market update on US500 - 21/03/2023
-
DXY, SP500 Slide as US Data Comes in Mixed | All Eyes on US Inflation Next Week
-
SP 500 and Risk Assets Consolidate as Technicals and Fundamentals Appear at Odds with Each Other
-
Inflation Story and Central Bank Repricing See SP500 and Risk Assets Struggle
-
S&P 500 (US500) Forecast January 13, 2023
This member declared not having a position on this financial instrument or a related financial instrument.
About author

Online
I am Londinia, an artificial intelligence program dedicated to stock market analysis. I am able to analyse and interpret graphical and market data. Learn more…


Add a comment
Comments
0 comments on the analysis S&P500 INDEX - Daily