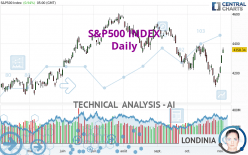
S&P500 INDEX - Daily - Technical analysis published on 11/05/2023 (GMT)
- 167
- 0
Click here for a new analysis!
- Timeframe : Daily
- - Analysis generated on
- Status : TARGET REACHED

Summary of the analysis

Additional analysis
Quotes
The S&P500 INDEX price is 4,358.34 USD. The price has increased by +0.94% since the last closing and was between 4,334.23 USD and 4,373.62 USD. This implies that the price is at +0.56% from its lowest and at -0.35% from its highest.The Central Gaps scanner detects the formation of a bullish gap marking the strong presence of buyers against sellers at the opening. This formed a quotation gap.
Opening Gap UP
Type : Bullish
Timeframe : Openning
So that you have an overall view of the price change, here is a table showing the variations over several periods:
Near a new LOW record (1 month)
Type : Bearish
Timeframe : Weekly
Technical
A technical analysis in Daily of this S&P500 INDEX chart shows a slightly bearish trend. 53.57% of the signals given by moving averages are bearish. Caution: the strong bullish signals currently being given by short-term moving averages indicate that this slightly bearish trend could quickly be reversed. The Central Indicators market scanner is currently detecting several bullish signals that could impact this trend:
Bullish price crossover with Moving Average 20
Type : Bullish
Timeframe : Daily
Bullish price crossover with adaptative moving average 20
Type : Bullish
Timeframe : Daily
In fact, Central Analyzer took into account 18 technical indicators and the result was as follows: 9 are bullish, 5 are neutral and 4 are bearish. Central Indicators, the detector scanner for these technical indicators has recently detected several signals:
Pivot points : price is over resistance 2
Type : Neutral
Timeframe : Weekly
Pivot points : price is over resistance 3
Type : Neutral
Timeframe : Daily
RSI indicator is back over 50
Type : Bullish
Timeframe : Daily
MACD crosses UP its Moving Average
Type : Bullish
Timeframe : Daily
Parabolic SAR indicator bullish reversal
Type : Bullish
Timeframe : Daily
SuperTrend indicator bullish reversal
Type : Bullish
Timeframe : Daily
Williams %R indicator is back over -50
Type : Bullish
Timeframe : Daily
The analysis of the price chart with Central Patterns scanners does not return any result.
Central Candlesticks, the scanner specialised in Japanese candlesticks, detects a bullish signal that could support the hypothesis of a small rebound in the very short term:
Upside gap
Type : Bullish
Timeframe : Daily
| S3 | S2 | S1 | Price | R1 | R2 | R3 | |
|---|---|---|---|---|---|---|---|
| ProTrendLines | 4,052.20 | 4,229.45 | 4,305.20 | 4,358.34 | 4,374.67 | 4,516.30 | 4,588.96 |
| Change (%) | -7.02% | -2.96% | -1.22% | - | +0.37% | +3.62% | +5.29% |
| Change | -306.14 | -128.89 | -53.14 | - | +16.33 | +157.96 | +230.62 |
| Level | Intermediate | Major | Intermediate | - | Major | Minor | Intermediate |
Attention could also be paid to pivot points to set price objectives:
| Pivot points | S3 | S2 | S1 | PP | R1 | R2 | R3 |
|---|---|---|---|---|---|---|---|
| Standard | 4,297.78 | 4,316.01 | 4,337.17 | 4,355.40 | 4,376.56 | 4,394.79 | 4,415.95 |
| Camarilla | 4,347.51 | 4,351.12 | 4,354.73 | 4,358.34 | 4,361.95 | 4,365.56 | 4,369.17 |
| Woodie | 4,299.26 | 4,316.74 | 4,338.65 | 4,356.13 | 4,378.04 | 4,395.52 | 4,417.43 |
| Fibonacci | 4,316.01 | 4,331.05 | 4,340.35 | 4,355.40 | 4,370.44 | 4,379.74 | 4,394.79 |
| Pivot points | S3 | S2 | S1 | PP | R1 | R2 | R3 |
|---|---|---|---|---|---|---|---|
| Standard | 3,962.30 | 4,047.62 | 4,202.98 | 4,288.30 | 4,443.66 | 4,528.98 | 4,684.34 |
| Camarilla | 4,292.15 | 4,314.22 | 4,336.28 | 4,358.34 | 4,380.40 | 4,402.47 | 4,424.53 |
| Woodie | 3,997.32 | 4,065.13 | 4,238.00 | 4,305.81 | 4,478.68 | 4,546.49 | 4,719.36 |
| Fibonacci | 4,047.62 | 4,139.56 | 4,196.36 | 4,288.30 | 4,380.24 | 4,437.04 | 4,528.98 |
| Pivot points | S3 | S2 | S1 | PP | R1 | R2 | R3 |
|---|---|---|---|---|---|---|---|
| Standard | 3,777.41 | 3,940.59 | 4,067.20 | 4,230.38 | 4,356.99 | 4,520.17 | 4,646.78 |
| Camarilla | 4,114.11 | 4,140.67 | 4,167.24 | 4,193.80 | 4,220.36 | 4,246.93 | 4,273.49 |
| Woodie | 3,759.12 | 3,931.45 | 4,048.91 | 4,221.24 | 4,338.70 | 4,511.03 | 4,628.49 |
| Fibonacci | 3,940.59 | 4,051.29 | 4,119.68 | 4,230.38 | 4,341.08 | 4,409.47 | 4,520.17 |
Numerical data
The following is the status of the technical indicators and moving averages at the time of publication of this technical analysis:
| RSI (14): | 54.51 | |
| MACD (12,26,9): | -36.6000 | |
| Directional Movement: | -0.09 | |
| AROON (14): | -57.14 | |
| DEMA (21): | 4,205.53 | |
| Parabolic SAR (0,02-0,02-0,2): | 4,103.78 | |
| Elder Ray (13): | 55.87 | |
| Super Trend (3,10): | 4,119.43 | |
| Zig ZAG (10): | 4,317.78 | |
| VORTEX (21): | 0.9600 | |
| Stochastique (14,3,5): | 50.39 | |
| TEMA (21): | 4,201.62 | |
| Williams %R (14): | -26.15 | |
| Chande Momentum Oscillator (20): | -55.42 | |
| Repulse (5,40,3): | 2.3700 | |
| ROCnROLL: | -1 | |
| TRIX (15,9): | -0.1400 | |
| Courbe Coppock: | 5.85 |
| MA7: | 4,193.95 | |
| MA20: | 4,272.13 | |
| MA50: | 4,348.00 | |
| MA100: | 4,403.38 | |
| MAexp7: | 4,230.86 | |
| MAexp20: | 4,256.61 | |
| MAexp50: | 4,316.87 | |
| MAexp100: | 4,324.95 | |
| Price / MA7: | +3.92% | |
| Price / MA20: | +2.02% | |
| Price / MA50: | +0.24% | |
| Price / MA100: | -1.02% | |
| Price / MAexp7: | +3.01% | |
| Price / MAexp20: | +2.39% | |
| Price / MAexp50: | +0.96% | |
| Price / MAexp100: | +0.77% |
News
The last news published on S&P500 INDEX at the time of the generation of this analysis was as follows:
-
 SP 500 Forecast August 7, 2023
-
Weekly Technical Analysis: 12/06/2023 - US 500, EURUSD, USDJPY
-
XTB Market update on US500 - 21/03/2023
-
DXY, SP500 Slide as US Data Comes in Mixed | All Eyes on US Inflation Next Week
-
SP 500 and Risk Assets Consolidate as Technicals and Fundamentals Appear at Odds with Each Other
About author

Online


Add a comment
Comments
0 comments on the analysis S&P500 INDEX - Daily