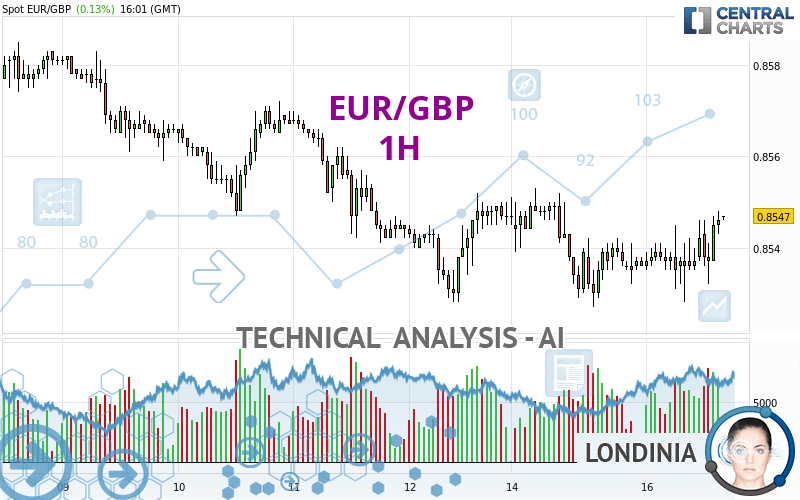
EUR/GBP - 1H - Technical analysis published on 04/16/2024 (GMT)
- 63
- 0
Click here for a new analysis!
- Timeframe : 1H
- - Analysis generated on
- Status : LEVEL MAINTAINED

Summary of the analysis

Additional analysis
Quotes
EUR/GBP rating 0.8547 GBP. The price registered an increase of +0.13% on the session and was between 0.8528 GBP and 0.8548 GBP. This implies that the price is at +0.22% from its lowest and at -0.01% from its highest.A study of price movements over other periods shows the following variations:
Near a new LOW record (5 years)
Type : Bearish
Timeframe : Weekly
Near a new HIGH record (1 year)
Type : Bullish
Timeframe : Weekly
Near a new HIGH record (1st january)
Type : Bullish
Timeframe : Weekly
Near a new HIGH record (1 month)
Type : Bullish
Timeframe : Weekly
Technical
Technical analysis of EUR/GBP in 1H shows an overall slightly bullish trend. 53.57% of the signals given by moving averages are bullish. The overall trend could accelerate as strong bullish signals from short-term moving averages are expected. The Central Indicators scanner detects bullish and bearish signals on moving averages that could impact this trend:
Bullish trend reversal : adaptative moving average 50
Type : Bullish
Timeframe : 1 hour
Bearish price crossover with adaptative moving average 50
Type : Bearish
Timeframe : 1 hour
Bearish price crossover with adaptative moving average 100
Type : Bearish
Timeframe : 1 hour
In fact, 14 technical indicators on 18 studied are currently bullish. Caution: the Central Indicators scanner currently detects an excess:
CCI indicator is overbought : over 100
Type : Neutral
Timeframe : 1 hour
Previous candle closed over Bollinger bands
Type : Neutral
Timeframe : 1 hour
CCI indicator: bearish divergence
Type : Bearish
Timeframe : 1 hour
RSI indicator: bearish divergence
Type : Bearish
Timeframe : 1 hour
Williams %R indicator is overbought : over -20
Type : Neutral
Timeframe : 1 hour
An analysis of the price chart with the Central Patterns scanner (detector of chart patterns and resistances and supports) shows a result that can have an impact on the price change:
Near resistance of channel
Type : Bearish
Timeframe : 1 hour
The Central Candlesticks scanner, specialised in Japanese candlesticks, did not identify any signals.
| S3 | S2 | S1 | Price | R1 | R2 | R3 | |
|---|---|---|---|---|---|---|---|
| ProTrendLines | 0.8510 | 0.8528 | 0.8541 | 0.8547 | 0.8553 | 0.8561 | 0.8572 |
| Change (%) | -0.43% | -0.22% | -0.07% | - | +0.07% | +0.16% | +0.29% |
| Change | -0.0037 | -0.0019 | -0.0006 | - | +0.0006 | +0.0014 | +0.0025 |
| Level | Major | Intermediate | Minor | - | Intermediate | Minor | Intermediate |
Pivot points can also be used to set your price objectives. Here is the price situation in relation to pivot points:
| Pivot points | S3 | S2 | S1 | PP | R1 | R2 | R3 |
|---|---|---|---|---|---|---|---|
| Standard | 0.8498 | 0.8513 | 0.8524 | 0.8539 | 0.8550 | 0.8565 | 0.8576 |
| Camarilla | 0.8529 | 0.8531 | 0.8534 | 0.8536 | 0.8538 | 0.8541 | 0.8543 |
| Woodie | 0.8497 | 0.8512 | 0.8523 | 0.8538 | 0.8549 | 0.8564 | 0.8575 |
| Fibonacci | 0.8513 | 0.8523 | 0.8529 | 0.8539 | 0.8549 | 0.8555 | 0.8565 |
| Pivot points | S3 | S2 | S1 | PP | R1 | R2 | R3 |
|---|---|---|---|---|---|---|---|
| Standard | 0.8461 | 0.8494 | 0.8521 | 0.8554 | 0.8581 | 0.8614 | 0.8641 |
| Camarilla | 0.8531 | 0.8536 | 0.8542 | 0.8547 | 0.8553 | 0.8558 | 0.8564 |
| Woodie | 0.8457 | 0.8493 | 0.8517 | 0.8553 | 0.8577 | 0.8613 | 0.8637 |
| Fibonacci | 0.8494 | 0.8517 | 0.8531 | 0.8554 | 0.8577 | 0.8591 | 0.8614 |
| Pivot points | S3 | S2 | S1 | PP | R1 | R2 | R3 |
|---|---|---|---|---|---|---|---|
| Standard | 0.8395 | 0.8449 | 0.8495 | 0.8549 | 0.8595 | 0.8649 | 0.8695 |
| Camarilla | 0.8514 | 0.8523 | 0.8532 | 0.8541 | 0.8550 | 0.8559 | 0.8569 |
| Woodie | 0.8391 | 0.8447 | 0.8491 | 0.8547 | 0.8591 | 0.8647 | 0.8691 |
| Fibonacci | 0.8449 | 0.8487 | 0.8511 | 0.8549 | 0.8587 | 0.8611 | 0.8649 |
Numerical data
The following is the status of technical indicators and moving averages registered at the time this technical analysis was created:
| RSI (14): | 61.15 | |
| MACD (12,26,9): | 0.0001 | |
| Directional Movement: | 8.4310 | |
| AROON (14): | 50.0000 | |
| DEMA (21): | 0.8539 | |
| Parabolic SAR (0,02-0,02-0,2): | 0.8530 | |
| Elder Ray (13): | 0.0006 | |
| Super Trend (3,10): | 0.8551 | |
| Zig ZAG (10): | 0.8546 | |
| VORTEX (21): | 1.0373 | |
| Stochastique (14,3,5): | 76.49 | |
| TEMA (21): | 0.8541 | |
| Williams %R (14): | -10.00 | |
| Chande Momentum Oscillator (20): | 0.0008 | |
| Repulse (5,40,3): | 0.0673 | |
| ROCnROLL: | 1 | |
| TRIX (15,9): | -0.0007 | |
| Courbe Coppock: | 0.08 |
| MA7: | 0.8555 | |
| MA20: | 0.8562 | |
| MA50: | 0.8552 | |
| MA100: | 0.8575 | |
| MAexp7: | 0.8541 | |
| MAexp20: | 0.8539 | |
| MAexp50: | 0.8541 | |
| MAexp100: | 0.8546 | |
| Price / MA7: | -0.09% | |
| Price / MA20: | -0.18% | |
| Price / MA50: | -0.06% | |
| Price / MA100: | -0.33% | |
| Price / MAexp7: | +0.07% | |
| Price / MAexp20: | +0.09% | |
| Price / MAexp50: | +0.07% | |
| Price / MAexp100: | +0.01% |
News
The last news published on EUR/GBP at the time of the generation of this analysis was as follows:
-
 Weekly Technical Outlook: 08/04/2024 - USDJPY, EURGBP, USDCAD
-
EUR/GBP Forecast April 2, 2024
-
EUR/GBP Forecast March 29, 2024
-
Technical Analysis: 13/03/2024 - EURGBP starts to take a bullish shape
-
Technical Analysis: 20/12/2023 - Could EURGBP bulls keep the rebound alive?
About author

Online


Add a comment
Comments
0 comments on the analysis EUR/GBP - 1H