Bitcoin volatility: study and history
- 1304
- 0
- 0
Is Bitcoin volatile? What is the average and maximum volatility of Bitcoin? Questions which were impossible to answer precisely without a study of the price history. That's why I looked at this study.
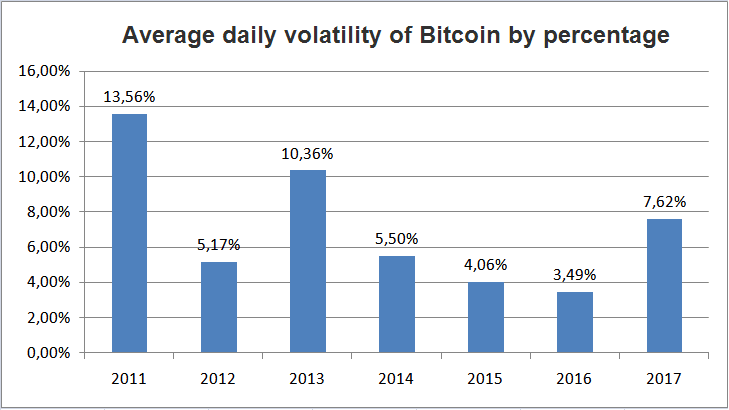
Over the last 6 years, from 2012 to 2017, the average daily volatility of Bitcoin ranged from 3.49% in 2016 to 10.36% in 2013.
In 2017, the average daily volatility was 7.62%.
The year 2011 is excluded because Bitcoin at that time was under US$1.
Here is a chart which summarizes the average daily volatility of Bitcoin by percentage, per year:
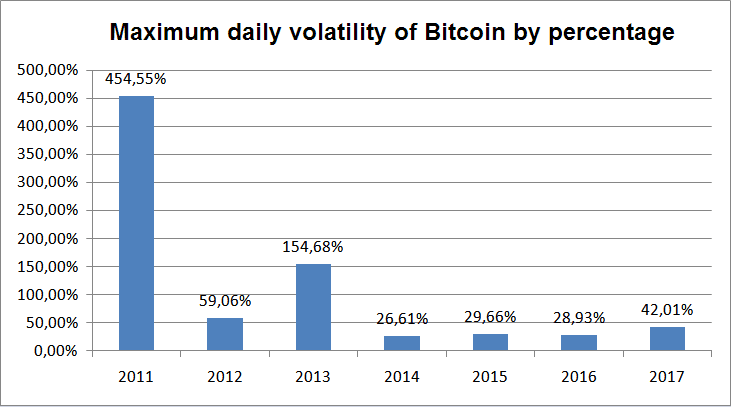
Over the last 6 years, from 2012 to 2017, the maximum daily volatility of Bitcoin ranged from 26.61% in 2014 to 154.68% in 2013.
In 2017, the maximum daily volatility was 42.01%.
The year 2011 is once again excluded because Bitcoin at that time was under US$1.
Here is a chart which summarizes the maximum daily volatility of Bitcoin by percentage, per year:
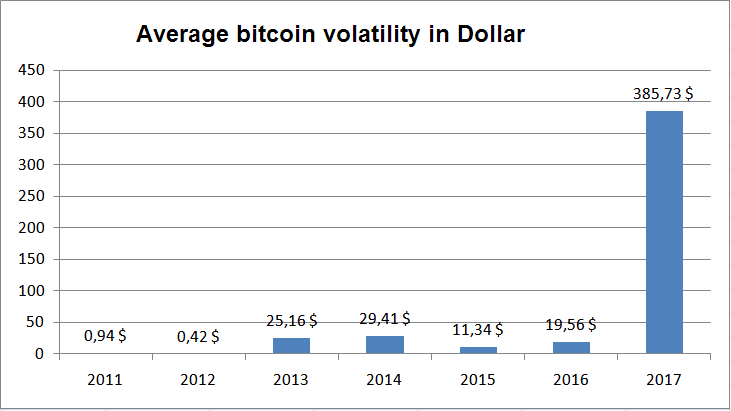
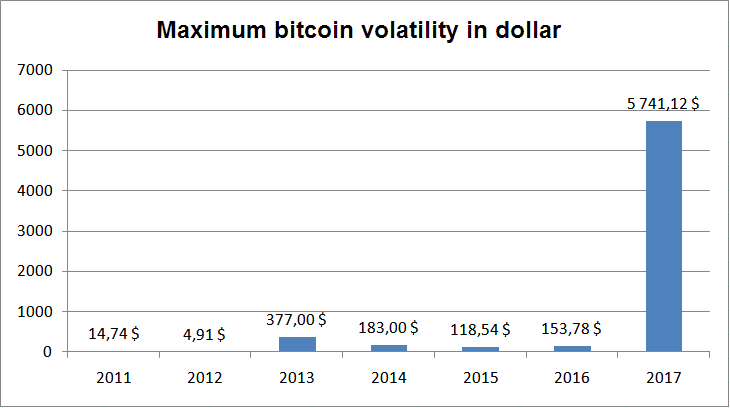
The evolution of Bitcoin was so "exponential" during those years that the study of volatility in US dollars provides no precise information. We can simply see that for the same percentage volatility, it represented increasingly large amounts in US dollars incremental to the soaring Bitcoin price. But in the end, Bitcoin was not really more volatile than in previous years.
If you need to retrieve Bitcoin’s rating history, here is a file attachment including "OHLC" (OPEN - HIGH - LOW - CLOSE) of Bitcoin from 10/02/2011 to 04/08/2018.
What is the average daily volatility of Bitcoin?
Over the last 6 years, from 2012 to 2017, the average daily volatility of Bitcoin ranged from 3.49% in 2016 to 10.36% in 2013.
In 2017, the average daily volatility was 7.62%.
The year 2011 is excluded because Bitcoin at that time was under US$1.
Here is a chart which summarizes the average daily volatility of Bitcoin by percentage, per year:
What is the maximum daily volatility of Bitcoin?
Over the last 6 years, from 2012 to 2017, the maximum daily volatility of Bitcoin ranged from 26.61% in 2014 to 154.68% in 2013.
In 2017, the maximum daily volatility was 42.01%.
The year 2011 is once again excluded because Bitcoin at that time was under US$1.
Here is a chart which summarizes the maximum daily volatility of Bitcoin by percentage, per year:
Bitcoin volatility calculated in US dollars
The evolution of Bitcoin was so "exponential" during those years that the study of volatility in US dollars provides no precise information. We can simply see that for the same percentage volatility, it represented increasingly large amounts in US dollars incremental to the soaring Bitcoin price. But in the end, Bitcoin was not really more volatile than in previous years.
Download Bitcoin’s price history
If you need to retrieve Bitcoin’s rating history, here is a file attachment including "OHLC" (OPEN - HIGH - LOW - CLOSE) of Bitcoin from 10/02/2011 to 04/08/2018.


