Autochartist: automatic technical analysis
- 2291
- 0
- 0
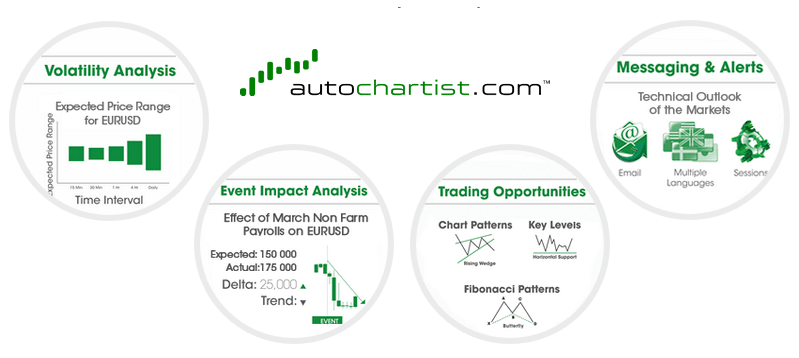
What is Autochartist?
Autochartist is a globally recognized and patented trading tool. Autochartist technology allows search engines to track thousands of financial instruments 24 hours a day, and alert traders to potential profitable trading opportunities in different forms of models. Autochartist also includes the PowerStats application, which provides comprehensive statistical data, providing the best assessment of the risk and volatility of financial instruments.
Autochartist chart trend model
Autochartist automatically detects chart patterns: bullish/bearish channels, triangles, head and shoulders, pennants, rectangles, double tops / double bottoms, etc.
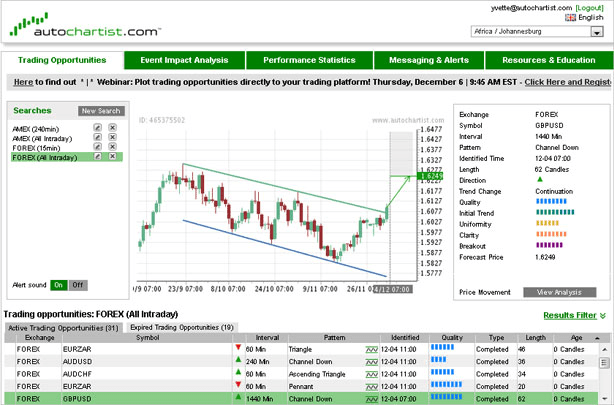
Receive audio and visual alerts when new and completed models are identified. Take advantage of the automatic forecast area plotted on completed chart models. Use the Autochartist performance statistics to display the success rates of models that reach the forecast area.
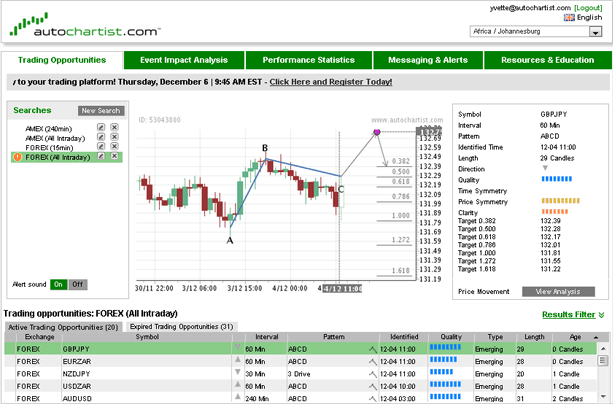
Fibonacci model of the Autochartist tool
Autochartist automatically identifies Fibonacci retracements and visually illustrates the levels of Support/Resistance expected according to the Golden Ratio theory. These levels can play a key role in setting stop loss levels and trading objectives. Throughout the day, it identifies and reports trend extensions, retracements, ABCDs or even Gatley and butterfly formations. Autochartist makes it easier for you to integrate technical analysis into your trading strategy.
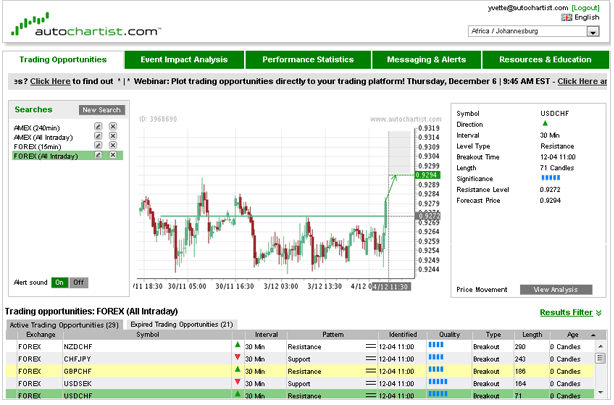
Horizontal resistance or support lines are often found at significant price levels. Using the key levels, Autochartist automatically identifies these course levels as "Break" or "Approach".
Key levels of the Autochartist tool
Autochartist automatically identifies key support and resistance levels and alerts traders when one of these levels breaks. These prices are identified as "Breakout" or "Approach".
Get a visual illustration of the support and resistance levels according to the golden ratio theory, and also audio and visual alerts for emerging and completed Fibonacci sequence models
PowerStats from the Autochartist tool:
PowerStats provides traders with statistics and information on relevant market price movements. It is an extremely useful application for developing new trading plans.
PowerStats gives you:
- The average movement in pips over specific periods.
- The probability of a sustained upward or downward movement
- The maximum prices forecast over specific periods
- Forecasts of price movements daily and weekly
PowerStats is a significant feature of Autochartist. It provides you with complete statistical data to help you set the appropriate stop loss/limit levels, and to choose the instruments that suit you.
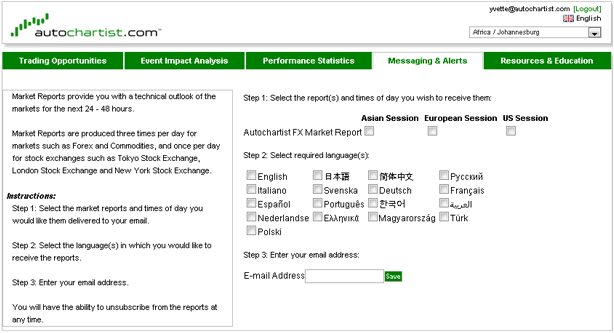
The Autochartist tool’s market reports
Autochartist Market Reports are automatically generated using a special electronic recognition model. These reports are identical to the technical analysis reports provided by analysts (except that they do not contain any bias).
This allows brokers to provide their clients with regular reports (with the white label option). These are sent by e-mail or web and in several languages. The instruments and markets covered in the reports can be defined in advance to better target the specific needs of clients.
Fund managers also benefit from these "Autochartist" market reports to demonstrate to their clients that they are maintaining focus on what is happening in the markets throughout the trading session.
In summary:
-Information provided at regular intervals
- Customizable for certain markets/instruments
- Available in several languages
- Can be used as a white label
- Can be sent by web or email
The advantages of Autochartist
Intraday analysis
Autochartist provides traders with early notifications of potential trading opportunities throughout the day.
Areas for forecasting transaction opportunities
Autochartist automatically draws an area for forecasting the expected price levels on the completed models. The prices reach the forecast areas with a 70% success rate.
Quality indicators
Each model is accompanied by an automated visual analysis that uses a combination of four unique characteristics to give the model a quality score.
Saving time
You no longer have to rely on years of training to recognize key trading models and levels. Autochartist analyses a wide range of market price data and automatically detects predefined models and key levels.
Alerts
Autochartist provides audio and visual alerts for trading opportunities, including graph templates, Fibonacci models and key levels. All completed and emerging opportunities are grouped onto a single screen.
Trading style
Autochartist automatically draws support and resistance lines, which is suitable for both breakthrough traders and traders interested in reversals.
Highly customizable searches
You can define your search criteria to filter out unwanted data, keeping only the information most relevant to your own trading style.
Training
The Autochartist service is accompanied by guides and training videos within the application itself to allow traders to make the most of graph templates and technical analysis when trading on a daily basis.
Launching Autochartist from MT4
Drag and drop the Autochartist Web Indicator onto your trading platform and the application will automatically launch in a new window, without you having to log in again. Similarly, simply drag and drop one of Autochartist's custom indicators onto the MT4 platform to clearly display models and prices by overlay.
Suitable for most portable devices
Autochartist has been designed to be used with iPad browsers and other similar portable devices.


