From a blank chart to technical analysis
- 2762
- 0
- 0
Are you a novice trader? Have you just opened your trading platform and all your charts are blank?
Before starting to plot lines, or adding technical indicators, it is firstly important to determine which time unit to use on your chart. The choice of time unit in Trading is a function of:
- your trading horizon (investment horizon)
- your trading preferences related to your strategy and trading method
- the time you have available for trading.
Have you chosen your time unit? Good!
Subsequently, when your trade is open, you need to stick to this time unit; do not analyse smaller or larger time units. You can always find a time unit that contradicts your trade and sows doubt in your mind.
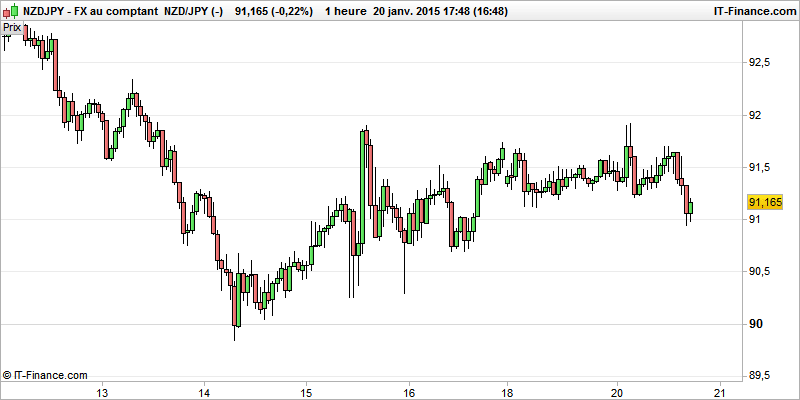
Throughout this page I use a 1 hour chart for the NZD/JPY pair (taken at random, and the only chart which I currently have not plotted.)
So here's what your chart looks like; how do you know if you should buy, sell, or stay flat as it's blank.
Multi-time frame analysis (multi-time units) or uni-time frame analysis (a single time unit)
It is common to see traders analysing the longer time unit so as to determine the current trend on a chart better and to identify support and resistance levels better.
Example: a trader who trades on a 15 minute time unit first analyses the 1 hour time unit so as to have a more global view of price changes in the medium term.
For my part, I find it easier to zoom out a chart to the maximum, rather than analyse the longer time unit. The choice is yours. These are two valid ways to proceed.
- The trend chart enables determination of the trading direction, based on the trend and the support and resistance levels called "medium term" in relation to your signal chart (See also: How to trade support and resistance line breaks).
- The signal chart enables opportunities for opening/exiting a trade to be determined.
NB: For my part, the unzoomed chart acts as a trend chart; and the zoomed chart acts as a signal chart.
Always analyse from the farthest (most unzoomed, and which takes into account a significant number of candlesticks, and therefore a distant horizon), to the nearest (most zoomed, and which, this time, only takes into account the final candlesticks, and therefore the last price movements called "short term" in relation to your trend chart).
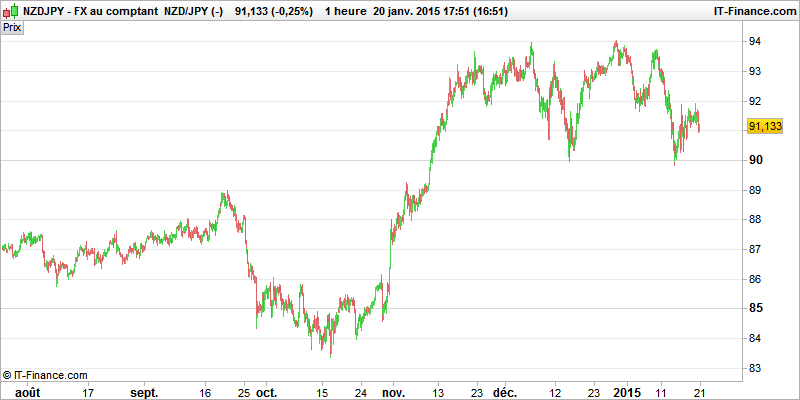
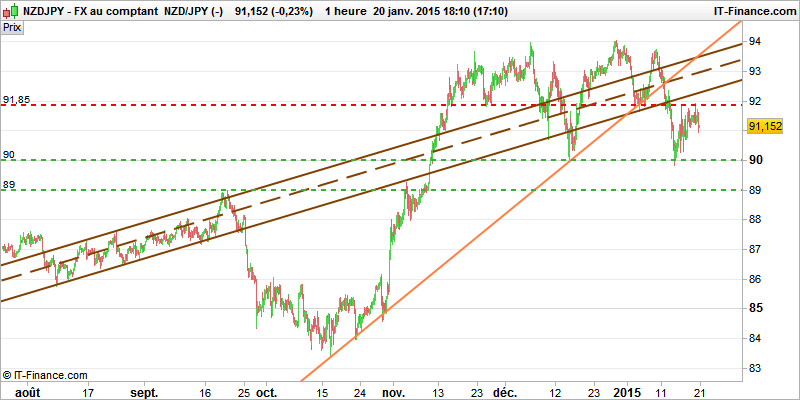
Step 1: Start by displaying the trend chart (or chart of a longer time unit, or for me: the unzoomed 1 hour chart of the NZD/JPY pair).
Step 2: Do not focus on the last movements or the detection of chart patterns which would necessarily have an impact on the candlestick in the process of being formed; conversely, rather look at old patterns (even if they have no importance at all; you never know; from time to time, some old patterns become current again). So I detect an old bullish channel. I plot it with brown lines. And I see that this bullish channel was very useful again last month. The price is now under it; unless there is a rebound, it should not be useful in the very short term.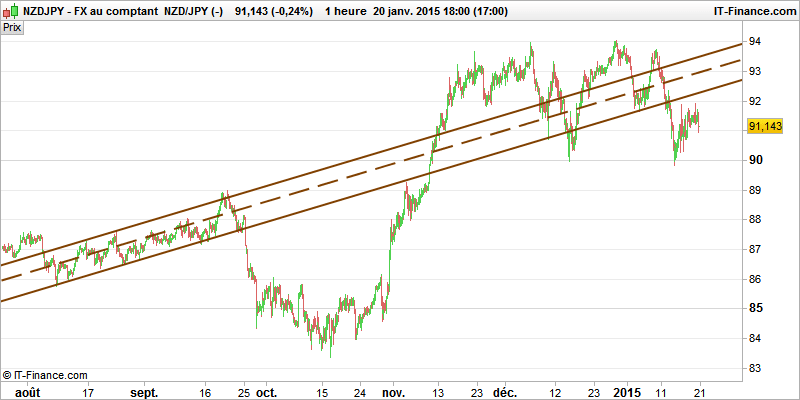
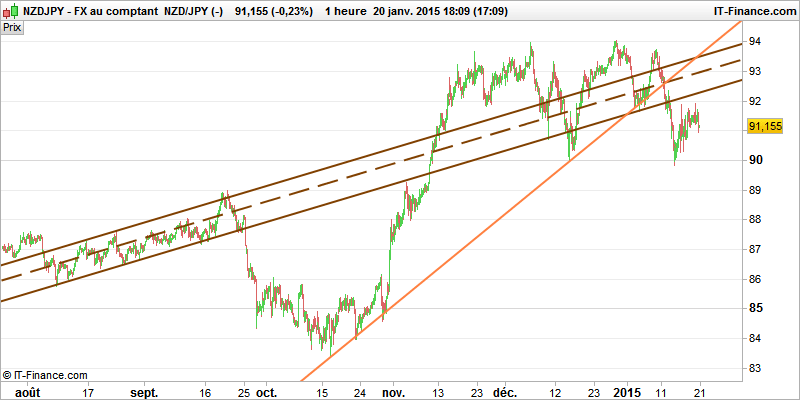
Step 2 b: Look for any patterns or lines that started in the past. In this way I discover a bullish oblique (orange line). It's broken too.
Step 3: Search for key (important) levels in relation to the current price. There is no need, for the moment, to plot the resistance at 94 points. There is always time to plot it later if the price bounces back to about this level. In this way I discover 2 support lines at 90 and 89 points; and 1 resistance line at 91.85 points.
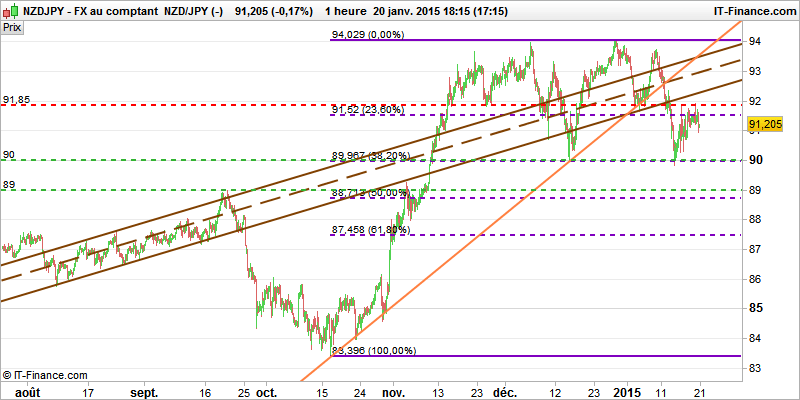
Stage 4: Given the last bullish rally, I add a Fibonacci retracement in purple.
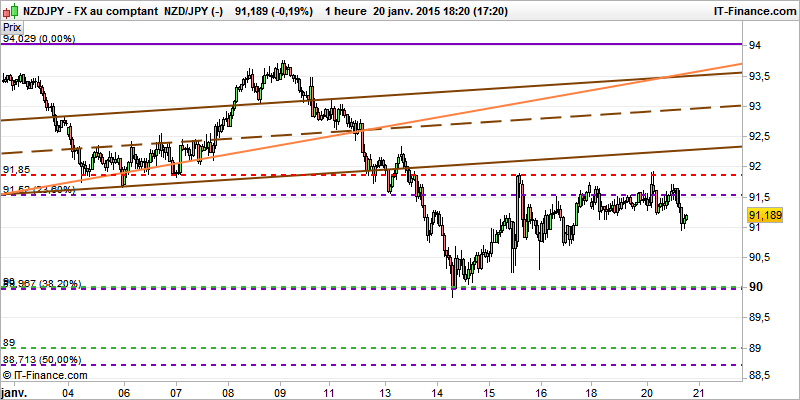
Step 5: The trend chart’s analysis is complete; I can now switch to the signal chart (for me: the zoomed chart).
I discover that 91.85 (old support level) has been used twice as a resistance level. Before that, on 14th January, the price found support on the Fibonacci retracement level 38.20% located at 89.96 points (level to within 4 pips equivalent to the support located at 90 points).
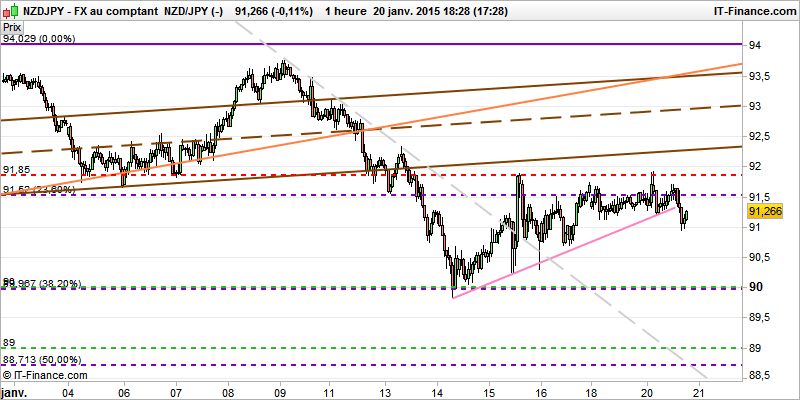
Step 6: Look for lines to add in the short term. I note that there are two trend lines. The bearish downward slant (grey dotted line) is not very useful. On the other hand, the short term bullish slant (pink segment) has been broken (giving a bearish signal).
Only after all these analytical steps can you finally add technical indicators (Pivot points, RSI + discrepancies, MACD, Moving averages and others).
Should we buy, sell or remain flat using this analysis?
Depending on your trading strategy, your investment horizon, the profit per trade you are looking to make, your investment decisions will be different from those of other traders (although you have the same analysis chart).
Some traders go short at the break in the short term bullish trend line (pink segment) and aim for a return on the 90 points in support.
Others remain bullish in the background and wait for a return above 91.85 points to start trading only buying positions again.
Others more biased wait until the bearish trend is really confirmed (90 point bearish break) to consider going short.
Scalpers may aim for a new return on the 91.50 points since the price found support at 91 points.
Look at others' analyses, but do it according to YOUR own strategy!
How to do technical analysis well?
Before starting to plot lines, or adding technical indicators, it is firstly important to determine which time unit to use on your chart. The choice of time unit in Trading is a function of:
- your trading horizon (investment horizon)
- your trading preferences related to your strategy and trading method
- the time you have available for trading.
Have you chosen your time unit? Good!
Subsequently, when your trade is open, you need to stick to this time unit; do not analyse smaller or larger time units. You can always find a time unit that contradicts your trade and sows doubt in your mind.
Throughout this page I use a 1 hour chart for the NZD/JPY pair (taken at random, and the only chart which I currently have not plotted.)
So here's what your chart looks like; how do you know if you should buy, sell, or stay flat as it's blank.
Multi-time frame analysis (multi-time units) or uni-time frame analysis (a single time unit)
It is common to see traders analysing the longer time unit so as to determine the current trend on a chart better and to identify support and resistance levels better.
Example: a trader who trades on a 15 minute time unit first analyses the 1 hour time unit so as to have a more global view of price changes in the medium term.
For my part, I find it easier to zoom out a chart to the maximum, rather than analyse the longer time unit. The choice is yours. These are two valid ways to proceed.
The key is having a trend chart and a signal chart
- The trend chart enables determination of the trading direction, based on the trend and the support and resistance levels called "medium term" in relation to your signal chart (See also: How to trade support and resistance line breaks).
- The signal chart enables opportunities for opening/exiting a trade to be determined.
NB: For my part, the unzoomed chart acts as a trend chart; and the zoomed chart acts as a signal chart.
Here is my way of transforming a blank chart into a technical analysis chart
Always analyse from the farthest (most unzoomed, and which takes into account a significant number of candlesticks, and therefore a distant horizon), to the nearest (most zoomed, and which, this time, only takes into account the final candlesticks, and therefore the last price movements called "short term" in relation to your trend chart).
Step 1: Start by displaying the trend chart (or chart of a longer time unit, or for me: the unzoomed 1 hour chart of the NZD/JPY pair).
Step 2: Do not focus on the last movements or the detection of chart patterns which would necessarily have an impact on the candlestick in the process of being formed; conversely, rather look at old patterns (even if they have no importance at all; you never know; from time to time, some old patterns become current again). So I detect an old bullish channel. I plot it with brown lines. And I see that this bullish channel was very useful again last month. The price is now under it; unless there is a rebound, it should not be useful in the very short term.
Step 2 b: Look for any patterns or lines that started in the past. In this way I discover a bullish oblique (orange line). It's broken too.
Step 3: Search for key (important) levels in relation to the current price. There is no need, for the moment, to plot the resistance at 94 points. There is always time to plot it later if the price bounces back to about this level. In this way I discover 2 support lines at 90 and 89 points; and 1 resistance line at 91.85 points.
Stage 4: Given the last bullish rally, I add a Fibonacci retracement in purple.
Step 5: The trend chart’s analysis is complete; I can now switch to the signal chart (for me: the zoomed chart).
I discover that 91.85 (old support level) has been used twice as a resistance level. Before that, on 14th January, the price found support on the Fibonacci retracement level 38.20% located at 89.96 points (level to within 4 pips equivalent to the support located at 90 points).
Step 6: Look for lines to add in the short term. I note that there are two trend lines. The bearish downward slant (grey dotted line) is not very useful. On the other hand, the short term bullish slant (pink segment) has been broken (giving a bearish signal).
Analysis complete!
Only after all these analytical steps can you finally add technical indicators (Pivot points, RSI + discrepancies, MACD, Moving averages and others).
Should we buy, sell or remain flat using this analysis?
Depending on your trading strategy, your investment horizon, the profit per trade you are looking to make, your investment decisions will be different from those of other traders (although you have the same analysis chart).
Some traders go short at the break in the short term bullish trend line (pink segment) and aim for a return on the 90 points in support.
Others remain bullish in the background and wait for a return above 91.85 points to start trading only buying positions again.
Others more biased wait until the bearish trend is really confirmed (90 point bearish break) to consider going short.
Scalpers may aim for a new return on the 91.50 points since the price found support at 91 points.
Look at others' analyses, but do it according to YOUR own strategy!


