Chart pattern: Bullish flag
- 8436
- 0
- 0
What is a bullish flag?
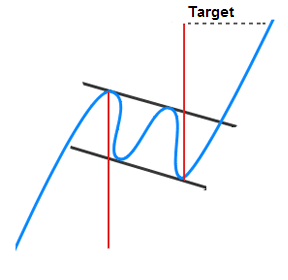
A bullish flag is a continuation pattern. The flag is formed by two parallel bearish lines that form a rectangle. It is therefore oriented in the opposite direction to the trend that it consolidates. Unlike a bullish channel, this figure is very short-term and indicates the need for buyers to take a break.
The bullish flag’s formation occurs in a bullish trend. Most often, this pause occurs halfway through the movement.
The objective is calculated in relation to the initial trend. The height of the entire bullish movement preceding the bullish flag’s formation is calculated and then plotted on the last high point of the pattern.
Graphical representation of a bullish flag
Statistics on bullish flags
Here are some statistics about bullish flags:
- In 87% of cases, there is a bullish exit
- In 90% of cases, it is a continuation pattern
- In 62% of cases, the target of the pattern is achieved
- In 10% of cases, a pullback intervenes on the resistance
- 76% of the bullish flags occur in the upper 1/3 of the annual range
Notes on bullish flags
- The stronger the movement before the flag is formed, the stronger the movement after the bullish exit will be
- The performance of a flag is much lower when it is oriented in the direction of the trend
- A flag with narrower straight lines is more effective than a flag with lines wider apart
- A flag is stronger if there are no false breaks
- Pullbacks are detrimental to the pattern’s performance
Trading strategies with bullish flags
The traditional strategy:
Entry: Open a long position at the break in the upper limit
Stop loss: The stop loss is placed under the last lowest one
Objective: Theoretical objective of the pattern
Advantage: The movement in the event of a bullish exit is often strong
Disadvantage: As the objective is not often achieved (62% of cases), it is necessary to determine the price objectives yourself.
The aggressive strategy:
Entry: Open a long position on a point of contact with the flag’s support line from the 3rd point of contact
Stop loss: The stop loss is placed above the last lowest point that has just been reached
Objective: Theoretical objective of the pattern
Advantage: Exit is bullish in 87% of cases
Disadvantage: The bullish break out has not yet been confirmed
For your information: The bullish flag is a continuation chart pattern. Its opposite is a bearish flag.


