Detecting trend reversals in trading
- 4701
- 0
- 0
Detecting trend reversals is very useful in trading. It enables you to protect your gains by cutting your position or taking a position in the opposite direction to the current trend (counter trend trading). Trend reversals occur on all time units.
A reversal on a small unit of time does not mean that there will necessarily be a reversal on the longer unit of time. The change in the direction of the price can therefore be a reversal on one time unit and a simple correction on another time unit.
Let's look together at the tools at your disposal to detect a trend reversal.
Japanese candlesticks are the most widely used type of chart representation in technical analysis. They provide important information on investors’ psychology by displaying various data: opening price, closing price, and the highest and lowest prices over the candlestick’s period. Several configurations of Japanese candlesticks allow you to anticipate a correction or a reversal.
-
Dojis are candlesticks with a small body relative to the overall size of the candlestick. There are many types of dojis depending on whether the body is up, down, or in the middle, and whether you are in a bullish or bearish trend. Teaching you the different names is not the purpose of this article. Here's what you need to remember:
In a bullish trend: If a doji with a large high fuse appears following a bullish movement, there is a high probability of a bearish reversal.
In a bearish trend: If a doji with a large low fuse appears following a bearish movement, there is a high probability of a bullish reversal.
In a bullish/bearish trend: If a doji (small body in the middle) appears, there is a high probability of a reversal.
-
A bullish or bearish engulfing is a powerful Japanese candlestick configuration consisting of two candlesticks. The first bull or bear is wrapped by a second candlestick of a different colour.
In a bullish trend, the first candlestick must be bullish and a second bearish candlestick must include the first. The second candlestick therefore closes below the first.
In a bearish trend, the first candlestick must be bearish and a second bullish candlestick must include the first. The second candlestick closes above the first.
In a bullish/bearish trend: If the second candlestick is of a different colour and encloses more than half of the previous candlestick, this may be a sign of a reversal. This is called a bullish/bearish piercing.
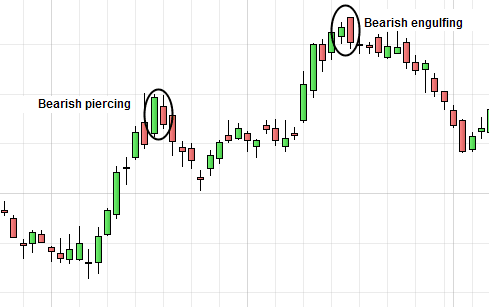
Chart patterns are a very effective tool for detecting trend reversals. Some patterns are called reversal patterns. Here are the main ones:
-
It is the break in the neck line of the line that gives the buy or sell signal. The theoretical objective is then calculated by plotting the height of the line onto the neck line. Here is an example of a double bottom:
-
In the case of an ascending wedge, a break in the lower boundary gives the sales signal. In the case of a descending wedge, a break in the upper boundary gives a buy signal. The break normally happens at 2/3 of the chart for the signal to be really relevant. Here is an example of an ascending wedge:
-
This figure is similar to the double bottom/top. It is the break in the neck line of the line that gives the buy or sell signal. The theoretical objective is then calculated by plotting the height of the head onto the neck line. Here is an example of a H&S:
To have more details on each chart pattern do not hesitate to consult the dedicated sheets on our forum.
With technical indicators, it is possible to draw chart patterns like on a price chart. The operation of the buy/sell signals is then the same. The indicators also suggest other alternatives for detecting a trend reversal:
-
A divergence occurs when a technical indicator marks highs/lows that go in the opposite direction of the highs/lows on the asset price. Here is a case of a classic bearish divergence: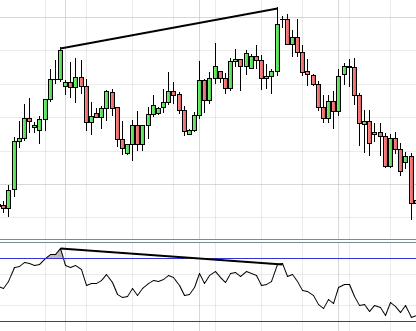
To find out about all the types of divergence, you can consult our learning sheet on "How to use divergence in technical analysis".
-
A buy signal is given when the price leaves the oversold zone. A sales signal is given when the price leaves the overbought zone. Warning, the fact that the price is oversold / overbought is not a viable signal to detect a reversal. The best technical indicator for this is the RSI, (limited indicator between 0 and 100). Here is an example:
There are many tools for detecting trend reversals. They can be used individually or together for increased relevance. It is important to specify that the technical configurations of a reversal do not always lead to a reversal of the trend but can simply be the sign of a correction (of greater or lesser magnitude).
A reversal on a small unit of time does not mean that there will necessarily be a reversal on the longer unit of time. The change in the direction of the price can therefore be a reversal on one time unit and a simple correction on another time unit.
Let's look together at the tools at your disposal to detect a trend reversal.
Detecting trend reversals with Japanese candlesticks
Japanese candlesticks are the most widely used type of chart representation in technical analysis. They provide important information on investors’ psychology by displaying various data: opening price, closing price, and the highest and lowest prices over the candlestick’s period. Several configurations of Japanese candlesticks allow you to anticipate a correction or a reversal.
-
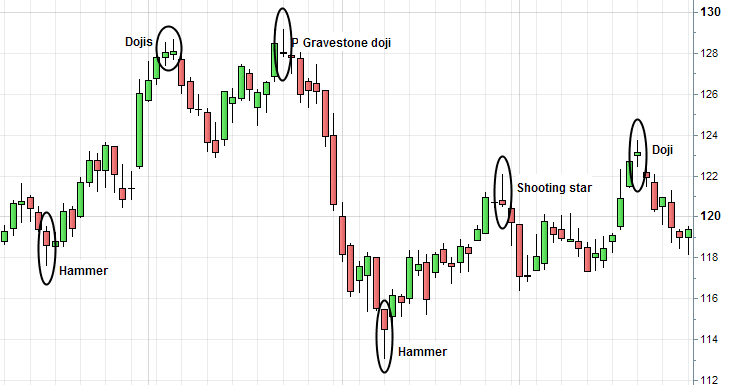
Dojis
Dojis are candlesticks with a small body relative to the overall size of the candlestick. There are many types of dojis depending on whether the body is up, down, or in the middle, and whether you are in a bullish or bearish trend. Teaching you the different names is not the purpose of this article. Here's what you need to remember:
In a bullish trend: If a doji with a large high fuse appears following a bullish movement, there is a high probability of a bearish reversal.
In a bearish trend: If a doji with a large low fuse appears following a bearish movement, there is a high probability of a bullish reversal.
In a bullish/bearish trend: If a doji (small body in the middle) appears, there is a high probability of a reversal.
-
Engulfings
A bullish or bearish engulfing is a powerful Japanese candlestick configuration consisting of two candlesticks. The first bull or bear is wrapped by a second candlestick of a different colour.
In a bullish trend, the first candlestick must be bullish and a second bearish candlestick must include the first. The second candlestick therefore closes below the first.
In a bearish trend, the first candlestick must be bearish and a second bullish candlestick must include the first. The second candlestick closes above the first.
In a bullish/bearish trend: If the second candlestick is of a different colour and encloses more than half of the previous candlestick, this may be a sign of a reversal. This is called a bullish/bearish piercing.
Detecting trend reversals with chart patterns
Chart patterns are a very effective tool for detecting trend reversals. Some patterns are called reversal patterns. Here are the main ones:
-
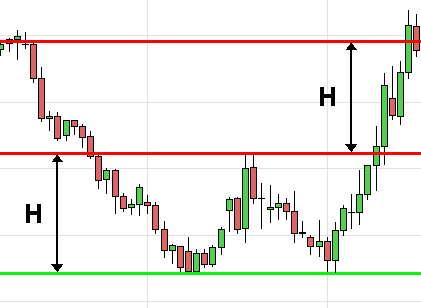
Double bottom/top - triple bottom/top
It is the break in the neck line of the line that gives the buy or sell signal. The theoretical objective is then calculated by plotting the height of the line onto the neck line. Here is an example of a double bottom:
-
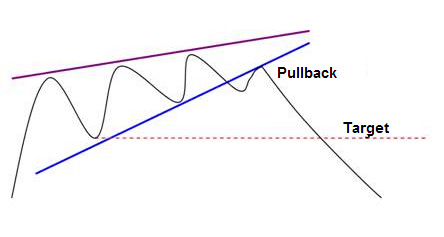
Ascending wedge / Descending wedge
In the case of an ascending wedge, a break in the lower boundary gives the sales signal. In the case of a descending wedge, a break in the upper boundary gives a buy signal. The break normally happens at 2/3 of the chart for the signal to be really relevant. Here is an example of an ascending wedge:
-
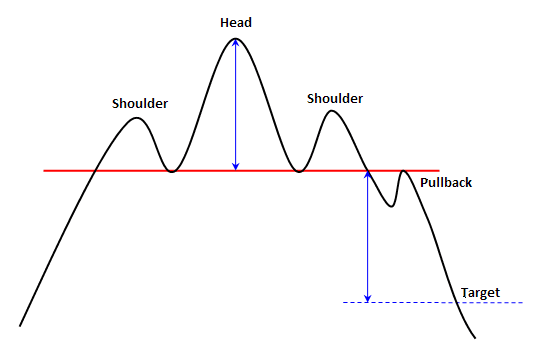
Head and shoulders (H&S)/ Inverse head and shoulders (H&Si)
This figure is similar to the double bottom/top. It is the break in the neck line of the line that gives the buy or sell signal. The theoretical objective is then calculated by plotting the height of the head onto the neck line. Here is an example of a H&S:
To have more details on each chart pattern do not hesitate to consult the dedicated sheets on our forum.
Detecting trend reversals with technical indicators
With technical indicators, it is possible to draw chart patterns like on a price chart. The operation of the buy/sell signals is then the same. The indicators also suggest other alternatives for detecting a trend reversal:
-
Divergence
A divergence occurs when a technical indicator marks highs/lows that go in the opposite direction of the highs/lows on the asset price. Here is a case of a classic bearish divergence:
To find out about all the types of divergence, you can consult our learning sheet on "How to use divergence in technical analysis".
-
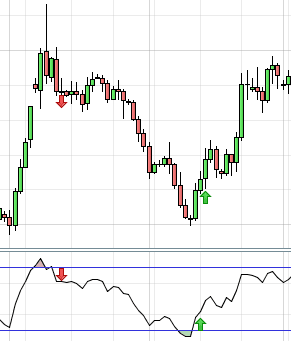
Exiting from an overbought/oversold zone
A buy signal is given when the price leaves the oversold zone. A sales signal is given when the price leaves the overbought zone. Warning, the fact that the price is oversold / overbought is not a viable signal to detect a reversal. The best technical indicator for this is the RSI, (limited indicator between 0 and 100). Here is an example:
Conclusion
There are many tools for detecting trend reversals. They can be used individually or together for increased relevance. It is important to specify that the technical configurations of a reversal do not always lead to a reversal of the trend but can simply be the sign of a correction (of greater or lesser magnitude).


