Signals of a trend recovery
- 2960
- 0
- 0
Knowing how to identify the signals of a recovery in a bullish/bearish trend is a key element of technical analysis.As we often say "The trend is your friend". Novice traders look at trading against the trend, this is a mistake. When dealing with the trend, you have higher expectations of gains in terms of points. In addition, the risk is often lower. Trading against the trend is more the domain of experienced traders who know how to Would not interpret the chart patterns and the different signals perfectly.
There are a lot of reversal trend signals. It is easy to find buying or selling opportunities using basic elements of technical analysis.
The base pattern for technical analysis is the bullish/bearish channel. When the an assets’ trend is pronounced, this pattern often appears.
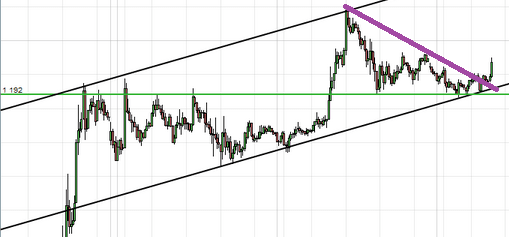
In a bullish channel, the signal for a trend recovery is given when the price rebounds off the lower limit.
In a bearish channel, the signal for a resumption of the trend is given when the price rebounds off the upper limit.
Warning, you must not open a position at the contact point with the high/low limit, it is essential to wait for a price reversal on the level before opening a position. Unless the price rebounds significantly off the low/high limit, you have to wait for a break in the slant that guides the correction movement within the channel.Here is an example with a bullish channel and the break of a bearish downward slant:
Some chart patterns are consolidation patterns. The most common patterns you see after a big bullish/bearish rally are flags or pennants.
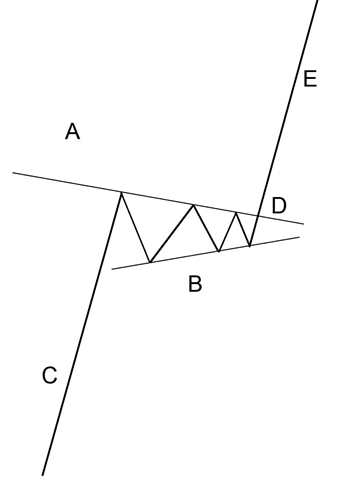
A pennant is a very short term chart pattern that resembles a small symmetrical triangle.In the case of an upward trend, the signal that the upward trend will resume is an upward exit. In the case of a bearish trend, the signal that the upward trend will resume is a downward exit.
Here is an example of a pennant in a bullish trend:
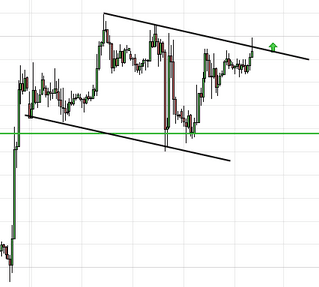
A flag is a chart pattern resembling a rectangle (or small channel) oriented in the opposite direction to the trend.In a bullish trend, the flag is pointing down and it is an upward exit that gives the signal that the trend has resumed.In a bearish trend, the flag is pointing up and it is a downward exit that gives the signal that the trend has resumed.
Here is an example of a flag in a bullish trend:
Warning: If ever the price exits the chart pattern in the opposite direction to the trend, do not take the buy/sell signal into account. The potential for an increase/decrease is very often limited. In that case look for another opportunity.
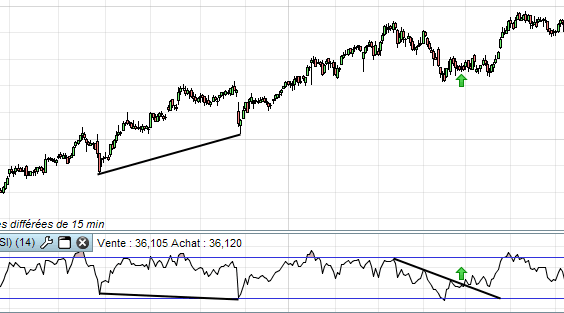
There are many technical indicators to detect a trend recovery.I will take the example of one of the most used: the RSI.If you need to use an indicator, choose this one. It allows you to detect discrepancies, identify an overbought/sold area exit, and generally view areas that show you a return of momentum in the direction of the trend.
On the chart below, we can distinguish two signals of a resumption in the trend:The first on a bullish divergence and the second on a downward slant break on the indicator.
In a bullish trend, leaving the oversold area on the RSI is also a bullish signal.In a bearish trend, it is the exit from the overbought zone of the RSI that gives the bearish signal
The old supports and resistances are good entry points to detect a recovery in the trend. The recovery signal intervenes either when the price makes a pullback on the level, or when the price course breaks the level again in the direction of the trend (in the case of a more forceful correction).
Warning:On a pullback trend resumption signal, you have to wait for a price rebound on the level in the direction of the trend before opening a position.
You can also use Fibonacci retracements to identify trend recovery signals.In the case of an upward trend, the signal is given when the price breaks an upward retracement.In the case of a bearish trend, the signal is given when the price breaks a downwards retracement.
There are a lot of reversal trend signals. It is easy to find buying or selling opportunities using basic elements of technical analysis.
Trend resumption signals in chart patterns
The base pattern for technical analysis is the bullish/bearish channel. When the an assets’ trend is pronounced, this pattern often appears.
In a bullish channel, the signal for a trend recovery is given when the price rebounds off the lower limit.
In a bearish channel, the signal for a resumption of the trend is given when the price rebounds off the upper limit.
Warning, you must not open a position at the contact point with the high/low limit, it is essential to wait for a price reversal on the level before opening a position. Unless the price rebounds significantly off the low/high limit, you have to wait for a break in the slant that guides the correction movement within the channel.Here is an example with a bullish channel and the break of a bearish downward slant:
Trend recovery signal on consolidation figure output
Some chart patterns are consolidation patterns. The most common patterns you see after a big bullish/bearish rally are flags or pennants.
A pennant is a very short term chart pattern that resembles a small symmetrical triangle.In the case of an upward trend, the signal that the upward trend will resume is an upward exit. In the case of a bearish trend, the signal that the upward trend will resume is a downward exit.
Here is an example of a pennant in a bullish trend:
A flag is a chart pattern resembling a rectangle (or small channel) oriented in the opposite direction to the trend.In a bullish trend, the flag is pointing down and it is an upward exit that gives the signal that the trend has resumed.In a bearish trend, the flag is pointing up and it is a downward exit that gives the signal that the trend has resumed.
Here is an example of a flag in a bullish trend:
Warning: If ever the price exits the chart pattern in the opposite direction to the trend, do not take the buy/sell signal into account. The potential for an increase/decrease is very often limited. In that case look for another opportunity.
Trend recovery signal on a technical indicator
There are many technical indicators to detect a trend recovery.I will take the example of one of the most used: the RSI.If you need to use an indicator, choose this one. It allows you to detect discrepancies, identify an overbought/sold area exit, and generally view areas that show you a return of momentum in the direction of the trend.
On the chart below, we can distinguish two signals of a resumption in the trend:The first on a bullish divergence and the second on a downward slant break on the indicator.
In a bullish trend, leaving the oversold area on the RSI is also a bullish signal.In a bearish trend, it is the exit from the overbought zone of the RSI that gives the bearish signal
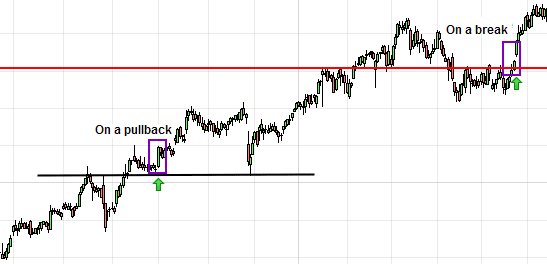
Trend recovery signals on resistances and supports
The old supports and resistances are good entry points to detect a recovery in the trend. The recovery signal intervenes either when the price makes a pullback on the level, or when the price course breaks the level again in the direction of the trend (in the case of a more forceful correction).
Warning:On a pullback trend resumption signal, you have to wait for a price rebound on the level in the direction of the trend before opening a position.
You can also use Fibonacci retracements to identify trend recovery signals.In the case of an upward trend, the signal is given when the price breaks an upward retracement.In the case of a bearish trend, the signal is given when the price breaks a downwards retracement.


