Chart pattern: Inverse head and shoulders (H&Si)
- 10825
- 0
- 0
What is an inverse Head and Shoulders pattern?
An inverse Head and Shoulders (H&Si) pattern is a trend reversal chart pattern.
This chart pattern is the opposite of the traditional "Head and Shoulder (H&S)” pattern.
The principle of the pattern is identical to that of a triple Bottom, with the exception that the second trough is lower than the other two.
In theory, the height of both shoulders should be the same, and the neck line should be horizontal.
In practice, the shoulders are often not of the same height, or the neck line ascends or descends (depending on the shape of the shoulders in the pattern).
Formation of an inverse head and shoulders pattern
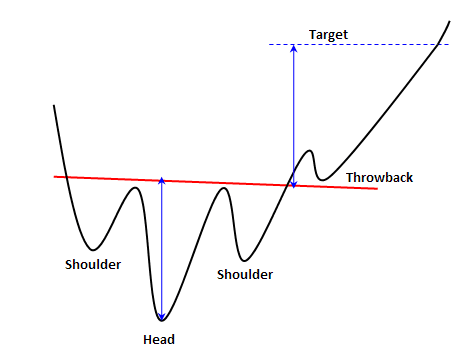
The first and third troughs (approximately the same height) form the shoulders.
The second trough (lower than that of the shoulders) forms the head.
There is no fixed rule, but some authors consider that the head height should be 1.5 to 2 times higher than that of the shoulders.
It is also agreed that the spaces between each trough must be identical to validate the inverse head and shoulder pattern.
The neck line is determined by the two highest points reached after the first shoulder and the head. These two high points are not always at the same level; the neck line can therefore be upward (38% of cases), downward (40% of cases) or horizontal (22% of cases).
The inverse head and shoulder pattern is definitively validated at the break out of the neck line.
The price objective is equal to the height between the neck line and the top of the head, plotted above the neck line.
Graphical representation of an inverse head and shoulder pattern
Statistics of inverse head and shoulder patterns
- In 98% of cases, the exit from the inverted head and shoulders pattern is bullish.
- In 74% of cases, the price reaches the objective of the inverse head and shoulders pattern when the neck line is broken.
- In 97% of cases, the bullish movement continues at the break of the neck line.
- In 52% of cases, after exiting, the price makes a pullback in support on the neck line of the inverse head and shoulders pattern.
Notes on inverse head and shoulder patterns
- The longer the movement before the formation of an inverse head and shoulders (H&Si) pattern, the stronger the bullish movement at the break of the neck line will be.
- The more abrupt the movement prior to the formation of an inverse head and shoulders (H&Si) pattern, the stronger the bullish movement at the break of the neck line will be.
- Inverse head and shoulder patterns with a downward neck line offer better performance.
- If the left shoulder is higher than the right shoulder, the inverse head and shoulder pattern offers better performance.
- After exiting the inverse head and shoulders pattern, pullbacks in support on the neck line are detrimental to performance.
For your information: The inverse head and shoulders (H&Si) pattern is a reversal chart pattern. Its opposite pattern is a head and shoulders (H&S).


