Resistance and support lines in trading
- 6544
- 0
- 0
Resistance and support lines are the basis of technical analysis. They are psychological zones where buyers and sellers clash. These are the levels at which the probability of a decrease or increase in the price of an asset is at its highest. Resistance and support lines are formed by the highest/lowest price points, connected by a line that can be horizontal, ascending or descending. Resistance and support lines are the result of the confrontation between an asset’s buyers and sellers. These are areas where some investors will take their profits, others will strengthen their position or trade the support or resistance line break.
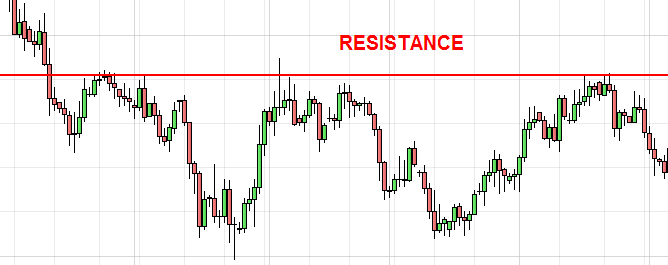
Resistance is a price level on which sellers have in the past taken control over buyers several times. This level blocks an asset’s price increase, with more sellers than buyers. This imbalance has the effect of causing a bearish price reversal.
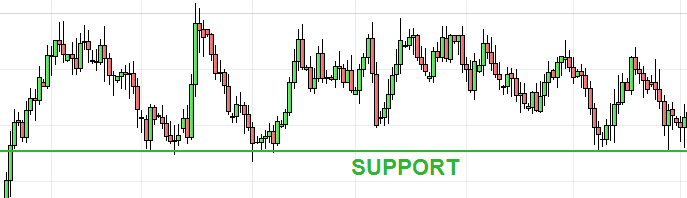
Support is a price level on which buyers have in the past taken control over sellers several times. This level blocks an asset’s price decrease, with more buyers than sellers. This imbalance has the effect of causing a bullish price reversal.
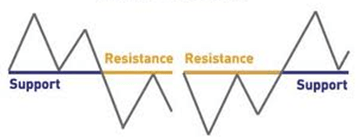
A resistance or support line is formed by at least two points of contact with the price otherwise it is just a highest/lowest point. The third contact point validates the resistance or the support line.
A resistance or support line can be:
-
-
-
-
-
-
From the fourth contact point, the probability of a break is high. It is rare that there is a fifth contact point with resistance or support lines.
-
-
Resistance and support lines are very useful in trading. They enable you to open a position and set price objectives. When a resistance/support line breaks, the first objective is the next resistance/support.
Generally speaking, a trader uses support lines to buy and resistance lines to sell. He could also trade the breaks. Here are the different scenarios that a trader may encounter depending on the type of resistance/support:
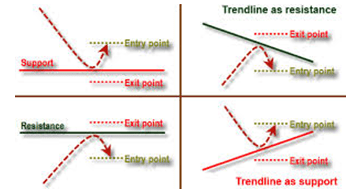
As you can see, it is unwise to open a position on the support or the resistance line. It is better to wait until there is a reversal (reversal doji, large bullish candlestick after a support line test, large bearish candlestick after a resistance line test, etc.) to have confirmation that the price level has played its resistance/support role well. A stop loss is placed above/below the last highest/lowest point. Don't forget to add a margin on the level of your stop loss to take into account the asset’s spread.
No, a resistance/support line does not always have the same value and it depends on several criteria:
-
On the other hand, depending on the time unit, a resistance or support line does not have the same significance. The longer the time unit, the higher in value the resistance/support lines. For example, a resistance/support line on a day chart has more weight than a resistance/support line on a 1 hour chart. It is therefore important to perform a longer term analysis in relation to the time unit of your trade to identify potential resistance/support areas and determine the trend. Depending on the global trend, you can set yourself a direction to trade (see one-way trading).
If you do not do this, some price reversals will seem incomprehensible and you will have a larger number of losing trades.
-
-
Definition of resistance and support
Resistance is a price level on which sellers have in the past taken control over buyers several times. This level blocks an asset’s price increase, with more sellers than buyers. This imbalance has the effect of causing a bearish price reversal.
Support is a price level on which buyers have in the past taken control over sellers several times. This level blocks an asset’s price decrease, with more buyers than sellers. This imbalance has the effect of causing a bullish price reversal.
A resistance or support line is formed by at least two points of contact with the price otherwise it is just a highest/lowest point. The third contact point validates the resistance or the support line.
Different types of resistance and support lines
A resistance or support line can be:
-
Horizontal
: The high points (resistance lines) and low points (support lines) are at the same level.-
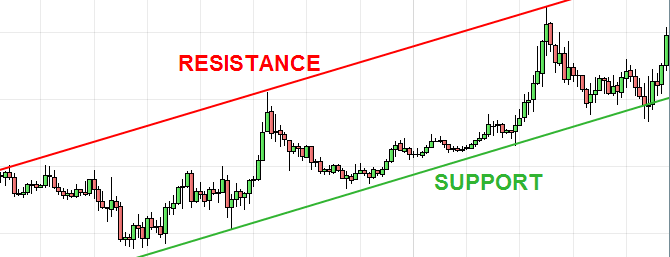
Ascending
: The low points are less and less low and the high points are higher and higher.-
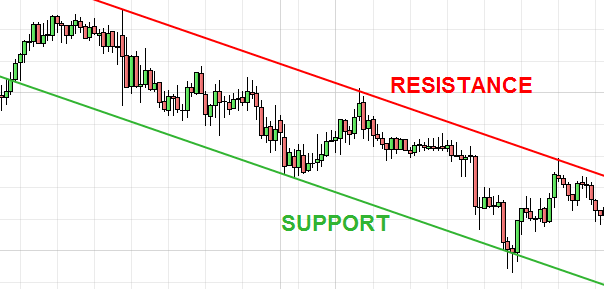
Descending
: The high points are less and less high and the low points are lower and lower.Rules for understanding resistance and support lines
-
Resistance or support lines are always valid once broken
: When a resistance line breaks, the price level becomes a support. On the other hand, when a support line breaks, the price level becomes a resistance.-
Resistance or support lines can be psychological
: Some levels are key psychological levels such as the 4,000, 5,000 or 6,000 points bars on the CAC40. They do not need to have been tested in the past (confrontation zone between buyers and sellers) to be active.-
The more a resistance or support line is tested, the higher the probability of it breaking
: The multiplication of tests shows the desire of buyers or sellers to break the level. In the case of a support line, buyers gradually run out of steam and the asset’s price rebounds less and less strongly on the support line. In the case a resistance line, sellers gradually run out of steam and the asset’s price rebounds less and less strongly on the resistance line.From the fourth contact point, the probability of a break is high. It is rare that there is a fifth contact point with resistance or support lines.
-
The larger the volumes, the more significant the resistance and support lines are
: Volumes are a good indicator to determine the significance of support and resistance lines. Effectively, it is on these levels that the confrontation between buyers and sellers is generally the strongest. A break in a support or resistance line must also happen where there are large volumes, the number of buyers or sellers then being greater.-
A resistance or support is an area
: Resistance and support lines should not be seen as an exact price level. It is possible the price occasionally exceeds the level on a wick and finally closes the candlestick above/below the level. To avoid this effect as much as possible, it is advisable to take into account high or low wicks of candlesticks when plotting a resistance or support level.How to use resistance and support lines in trading
Resistance and support lines are very useful in trading. They enable you to open a position and set price objectives. When a resistance/support line breaks, the first objective is the next resistance/support.
Generally speaking, a trader uses support lines to buy and resistance lines to sell. He could also trade the breaks. Here are the different scenarios that a trader may encounter depending on the type of resistance/support:
As you can see, it is unwise to open a position on the support or the resistance line. It is better to wait until there is a reversal (reversal doji, large bullish candlestick after a support line test, large bearish candlestick after a resistance line test, etc.) to have confirmation that the price level has played its resistance/support role well. A stop loss is placed above/below the last highest/lowest point. Don't forget to add a margin on the level of your stop loss to take into account the asset’s spread.
Does a resistance or support line always have the same value?
No, a resistance/support line does not always have the same value and it depends on several criteria:
-
Time unit
: Regardless of the time unit you trade on, resistance and support lines work in the same way. On the other hand, the longer the time unit, the more distant the price objective (the next resistance/support) is in terms of points.On the other hand, depending on the time unit, a resistance or support line does not have the same significance. The longer the time unit, the higher in value the resistance/support lines. For example, a resistance/support line on a day chart has more weight than a resistance/support line on a 1 hour chart. It is therefore important to perform a longer term analysis in relation to the time unit of your trade to identify potential resistance/support areas and determine the trend. Depending on the global trend, you can set yourself a direction to trade (see one-way trading).
If you do not do this, some price reversals will seem incomprehensible and you will have a larger number of losing trades.
-
Chart patterns
: Support and resistance lines have different values depending on whether or not they are associated with a chart pattern. For example, a resistance line may represent the upper boundary of an ascending triangle. Depending on the chart configuration, a resistance or support line should not be traded in the same way. I advise you to consult the section of our forum where training pages for each chart pattern are posted.-
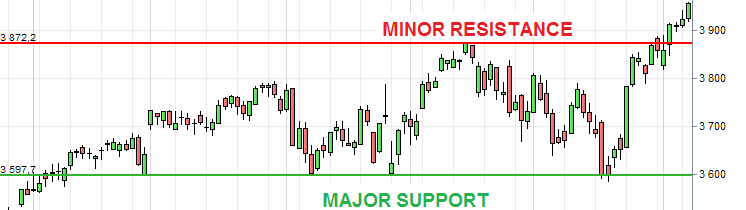
Minor / Major
: Some support/resistance lines are minor and others are major. A support/resistance line is said to be minor if it has only been tested once (break at the highest/lowest point) or has never been tested (psychological levels). Major support/resistance lines are defined as linking highest/lowest value points that have been tested several times in the past (as a support or resistance). We also talk about major support/resistance lines to talk about price levels on the time unit longer than that of your trade. The test of a major level has a higher impact and often causes a strong price rebound. Transaction volumes are higher. 


