Right-angled ascending broadening wedge
- 14845
- 0
- 0
What is a right-angled ascending broadening wedge?
A right-angled ascending broadening wedge is a downward reversal pattern.The pattern is formed by two diverging lines, the support is a horizontal line and the resistance is an oblique bullish one, so it is an inverted descending triangle.The oscillations between the two triangle terminals are therefore becoming increasingly large.Each line must be touched at least twice to be validated.
A right-angled ascending broadening wedge reflects investors’ growing nervousness and indecision.If the pattern is not spotted quickly, the movements may appear totally random and thus trap many investors.
This pattern’s formation has to be preceded by a bullish movement.Although one could think that this pattern is a reversal pattern because of its shape, it is more likely a mark of a lack of buyers in the bullish movement, which does not manage to become sustainable.
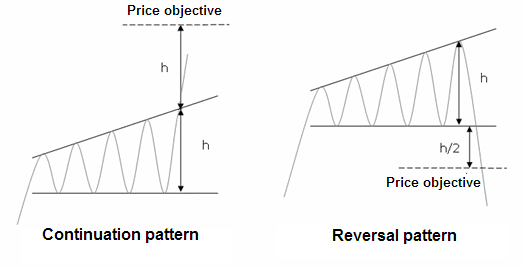
The price objective is given by plotting the top point of the triangle at its start where it breaks out.Another technique consists in plotting the maximum height of the triangle at the break out point.
Graphic representation of a right-angled ascending broadening wedge
Statistics of a right-angled ascending broadening wedge
Here are some statistics about a right-angled ascending broadening wedge:
- In 70% of cases, there is a bearish exit
- In 91% of cases, the minimum objective of the pattern is achieved by using the technique of the maximum height of the triangle.In the event of a bearish exit, the percentage drops to 43%.
- The failure rate is 6% (i.e. a horizontal exit)
- In 44% of cases, there is pullback in the case of a bullish exit and 72% in the case of a bearish exit
Notes on right-angled ascending broadening wedges
- Reversal pattern
- The movement is much greater if there is an upwards exit
- The configurations that perform best are those that are preceded by a slight movement before the triangle is formed.
- Bearish breaks perform better when the price line is in the lower third of the annual range and vice versa for bullish breaks
- Pullbacks are detrimental to performance
- Higher patterns perform better than the lower ones
Trading strategies for right-angled ascending broadening wedges
The traditional strategy:
Entry:Opening a short position at the support break
Stop loss:The stop loss is placed above the support
Objective:Theoretical objective of the pattern
Advantage:Minimum objective very often achieved (91% of cases)
Disadvantage:Pullbacks are common (72% of cases).It may therefore be wise to wait for the pullback to open a position
The aggressive strategy:
Entry:Opening a long position on the 3rd contact with the support
Stop loss:The stop loss is placed below the last lowest point
Objective:Opposite terminal of the triangle
Advantage:The amplitude of the movement will be significant in the event of a bounce towards the opposite terminal.Low risk
Disadvantage:More frequent bearish exits
The aggressive strategy (2):
Entry:Opening a short position from the 3rd point of contact with the resistance
Stop loss:The stop loss is placed above the last highest one
Objective:Opposite terminal of the triangle
Advantage:Bearish exits are more frequent
For your information:A Right-angled ascending broadening wedgeis a reversal chart pattern.Its opposite pattern is a right-angled descending broadening wedge.


